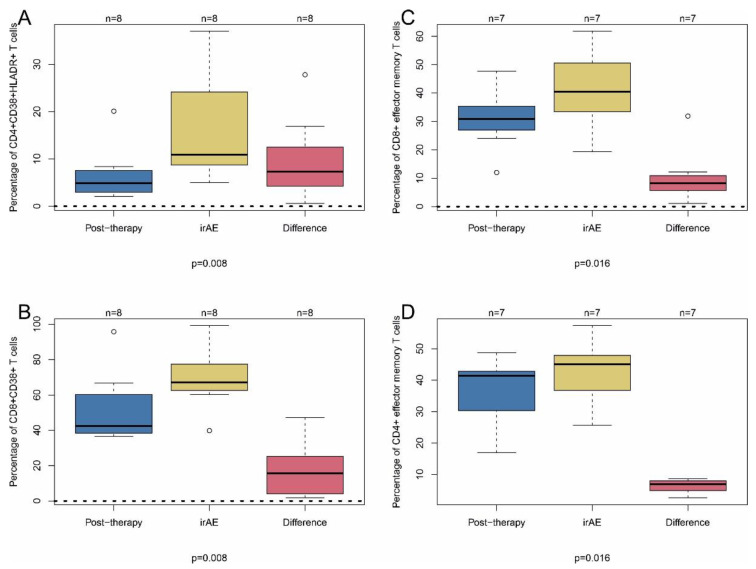
Figure 6.
Inflammatory T cell subpopulations in patients with irAE. PBMC were taken from patients immediately after first treatment on the same day (post-treatment; time point 2 in previous figures). In addition, PBMC were taken from patients at the time point of first appearance of adverse events (irAE) and analyzed by flow cytometry (FACS). The red boxplots illustrate the pairwise difference of post-first treatment and irAE measurements. (A) CD4+CD38+HLADR+ T cells. (B) CD8+CD38+ T cells. (C) CD8+ effector memory T cells. (D) CD4+ effector memory T cells. Nominal (unadjusted) p-values (Wilcoxon signed-rank test between post-therapy and irAE) are shown without adjustment for multiple testing. Data in (A) are given as percentage of CD38+HLADR+ cells total CD4+ cells. Data in (B) are given as percentage of CD38+ cells of total CD8+ cells. Data in (C,D) are given as percentage of CD4+ and CD8+ effector memory cells, respectively, of total CD4+ and CD8+ cells.

