Figure 1.
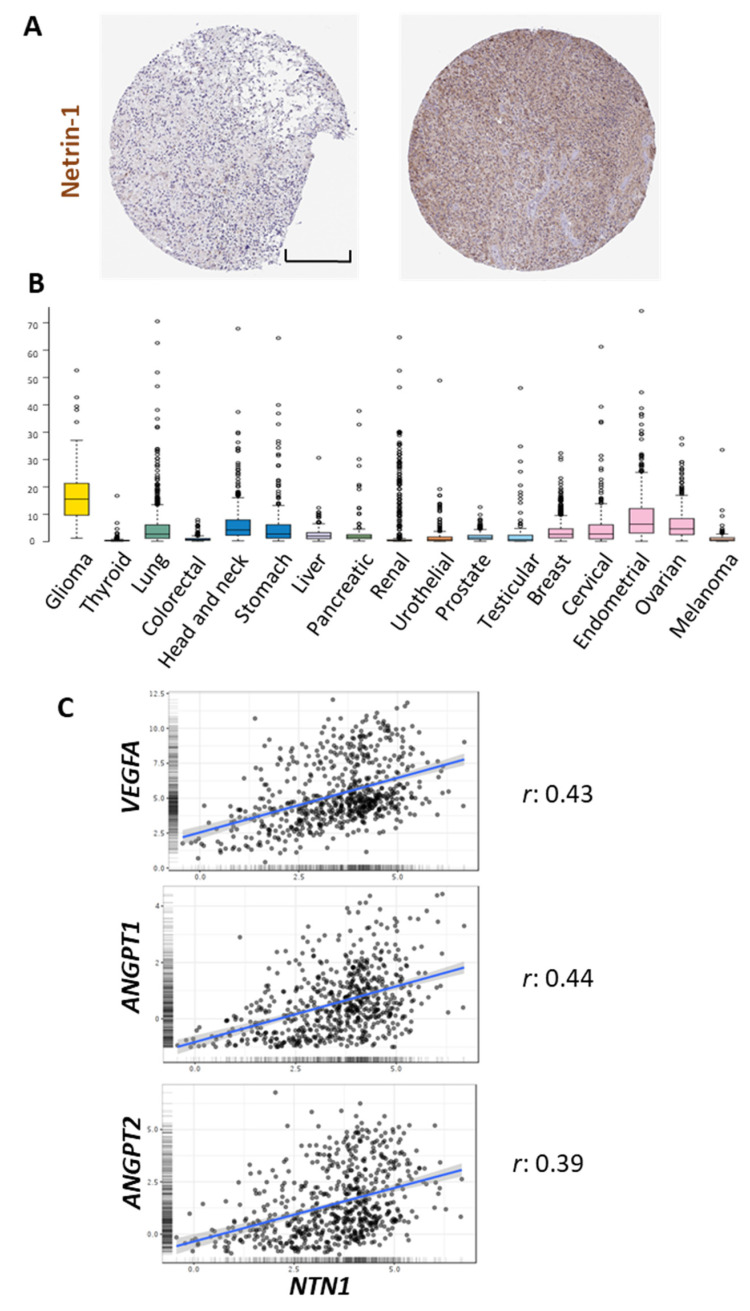
In silico analysis of NTN1 expression in gliomas. (A) Representative images of immunohistochemical staining of high-grade glioma samples using a Netrin-1 specific antibody. (B) RNA-seq data in 17 cancer types are reported as median FPKM (number Fragments Per Kilobase of exon per Million reads), generated by The Cancer Genome Atlas (TCGA). Data adapted under creative commons license from The Human Protein Atlas [66,67]. Images available from https://www.proteinatlas.org/ENSG00000065320-NTN1/pathology, accessed on 12 May 2021. (C) Pearson’s correlation analysis between the expression of NTN1 and VEGFA, ANGPT1, ANGPT2, using data from the Chinese Glioma Genome Atlas (CGGA) cohort visualized in the GlioVis data portal [68] (http://gliovis.bioinfo.cnio.es, accessed on 12 May 2021). The correlation coefficient (r) is shown on the right. Scale bar in A: 200 μm.

