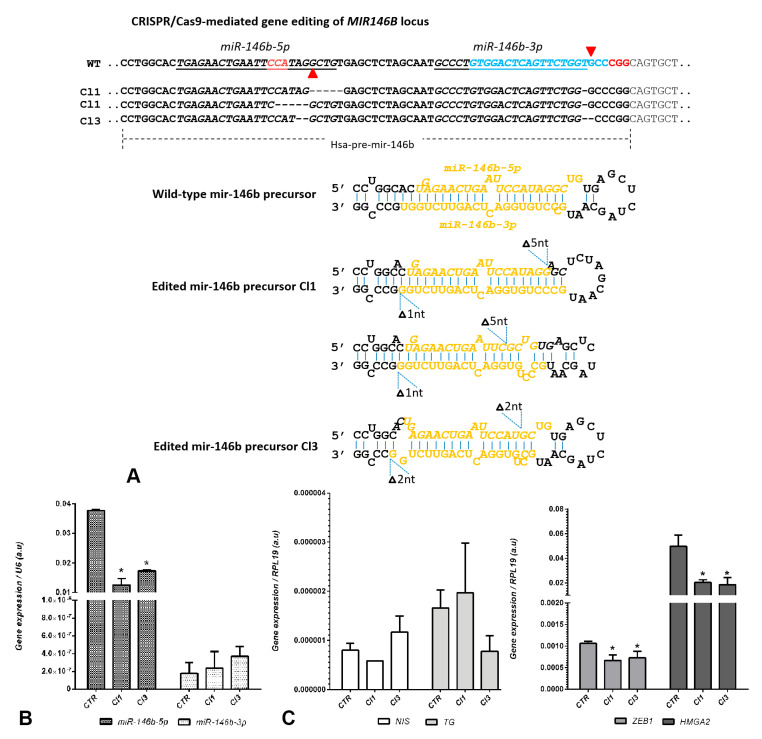
Figure 3.
CRISPR/Cas9n-mediated gene editing of MIR146B gene. (A) Comparison of the genomic region of MIR146B in KTC2-Cl1 (Cl1), KTC2-Cl3 (Cl3), and KTC2-CTR (WT). Underlined sequences are the miR-146b-5p and miR-146b-3p strands of mature miRNA generated by pre-mir-146b. Red arrow heads indicate the points of single-strand break guided by GuideA and GuideB adjacent to PAM sequence (NGG in red). The decomposition of the sequencing traces of KTC2-Cl1 PCR shows a heterogeneous population of cells with 5 nt deletion in the miR-146b-5p region (either to the 3′ or 5′ of the PAM site for GuideA) and a 1 nt deletion at the miR-146-3p region; the KTC2-Cl3 cell line shows a homogenous population with 2 nt deletion in the miR-146b-5p region and a 2 nt deletion at the miR-146b-3p region. The prediction of precursor miRNA folding for Cl1 and Cl3 is shown as a hairpin structure compared to the control (wild-type) hairpin generated in the RNAfold WebServer program. (B) Expression levels of miR-146b-5p and miR-146b-3p after gene editing with CRISPR/Cas9n in KTC2-Cl1 and Cl3 compared to KTC2-CTR. (C) Gene expression of thyroid differentiation genes NIS and TG, and EMT markers ZEB1 and HMGA2. Gene expression was calculated with Qgene using 2−deltact. * p < 0.05 vs. KTC2-CTR.

