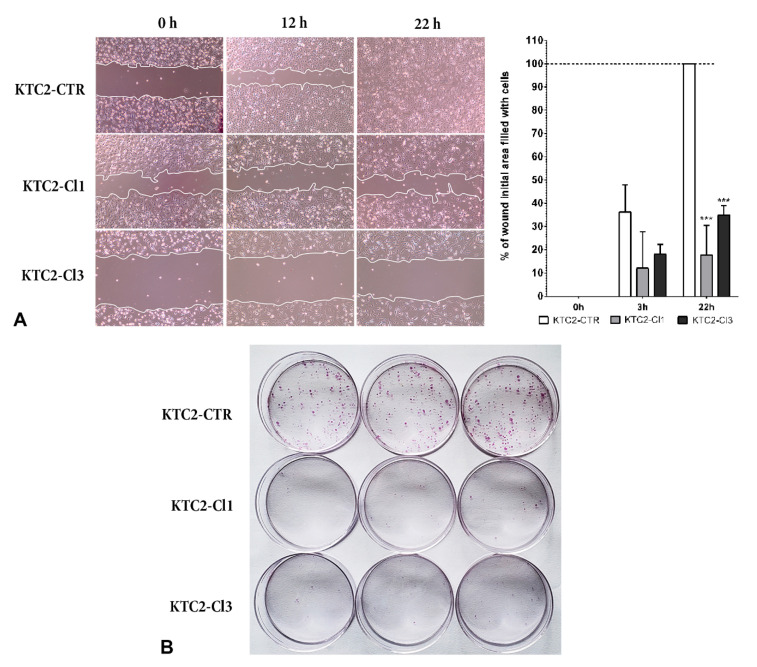
Figure 5.
(A) Wound healing assay to evaluate cell migration in mitomycin treated KTC2-CTR cells compared to KTC2-Cl1 and Cl3 cells. Representative image of the gap closure soon after wound (0 h) and after 3 h and 22 h. The graph shows quantification of the area of the wound filled with cells compared to 0 h area (0% filled) using ImageJ software. *** p < 0.01 vs. KTC2-CTR (B) Colony formation assay comparing KTC2-CTR, KTC2-Cl1 and KTC2-Cl3 cells’ ability to form clones after low density seeding for 8 days. Representative results of two independent experiments performed in triplicate.

