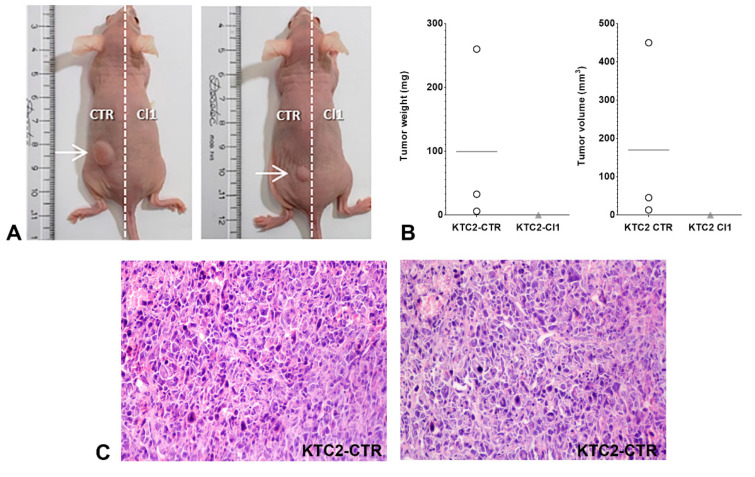
Figure 6.
(A) Representative image of animals injected with KTC2-CTR cells (in the left flank) and KTC2-Cl1 cells (in the right flank). (B) Tumor weight and volume of KTC2-CTR cells compared to KTC2-Cl1 cells (no tumor) after animal euthanasia in the endpoint. n = 3 animals. ◯ KTC2-CTR; ▲ KTC2-Cl1. (C) Histological section of KTC2-CTR tumor stained with H&E. Magnification: 200×.

