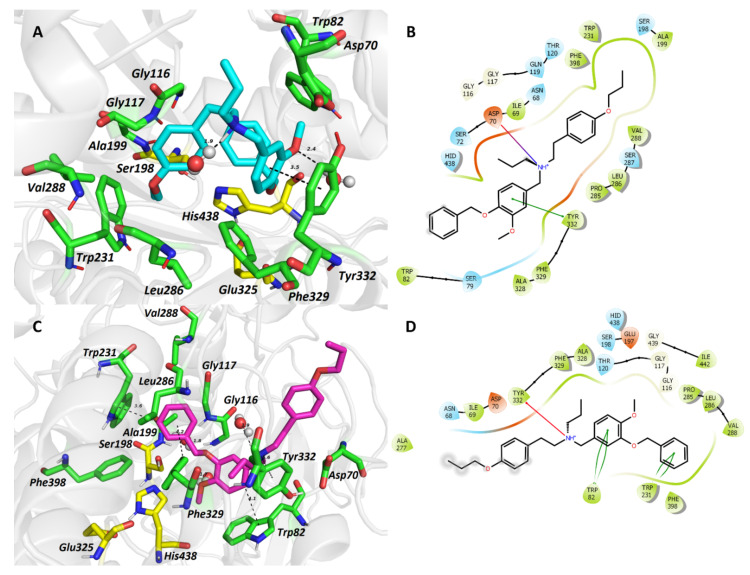
Figure 3.
The top-scored docking poses of ligands 5 (A,B) and 6 (C,D) in the hBuChE active site (PDB ID: 6QAA) [43] from MD simulation. The ligands are displayed in light blue (5, A) and purple (6, C); important amino acid residues responsible for ligand anchoring are shown in green. Catalytic triad residues are displayed in yellow. Important interactions are rendered by black dashed lines; distances are measured in Ångstroms (Å). The rest of the receptor is displayed in light-grey cartoon conformation (A,C). Figures (A,C) were created with The PyMOL Molecular Graphics System, Version 2.4.1, Schroödinger, LLC. Two-dimensional figures (B,D) were generated with Maestro 12.3 (Schrödinger Release, Schrödinger, LLC, New York, NY, USA, 2020).

