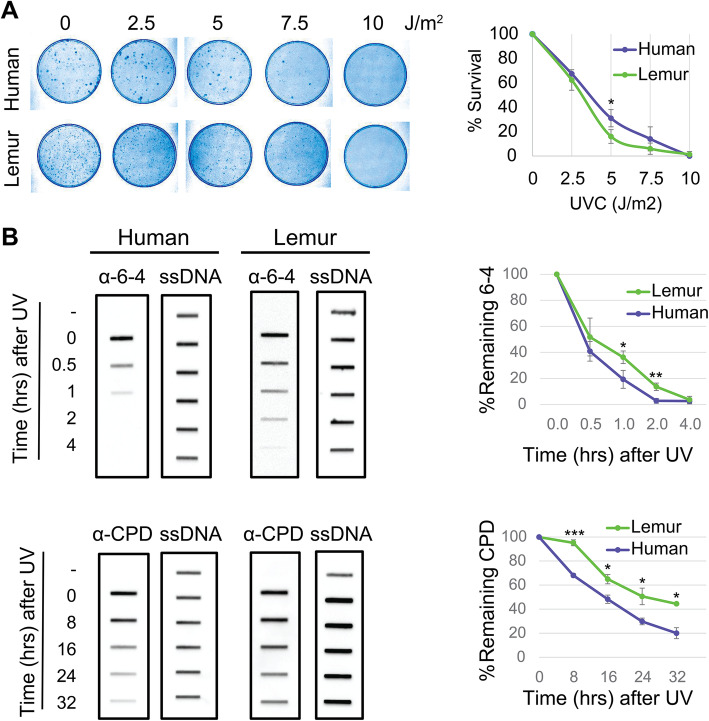
Fig. 2.
UV sensitivity and repair rates in human and lemur fibroblasts. (A) Clonogenic survival assay (left) and the quantified results (right). (B) Immunoslot blot repair assays to examine the repair kinetics of UV-induced DNA lesions for both organisms and each damage type (left). Remaining damage levels at each time point were quantified and plotted (right). All experiments were repeated three times, and graphed data are presented as (mean+/−SD). Tests (t-test) performed (H0:μhuman = μlemur) for each dosage (A) and time points (B). * P ≤ 0.05; ** P ≤ 0.01; *** P ≤ 0.001; rest P > 0.05

