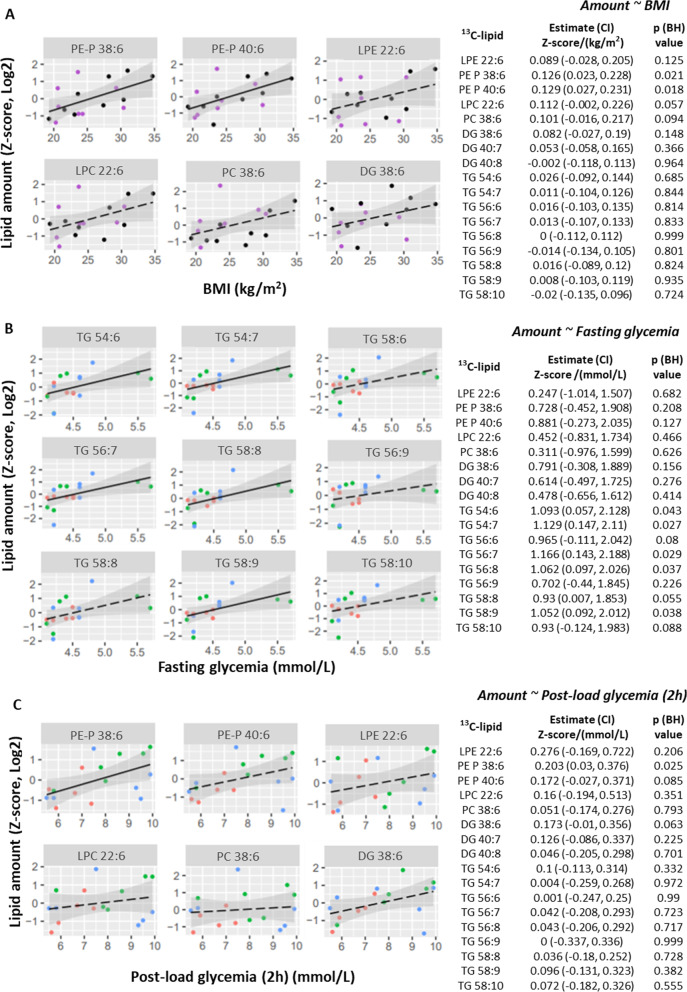
Fig. 3.
Variations in patterns of association between fasting glycemia (A), post-load (2 h) glycemia (B) and maternal BMI (C) with the amount of placental 13C-DHA lipids (Z-score, log2; n = 17 placenta). Linear regression was run with lipid as the outcome and glycemia or BMI as the predictor. The Benjamini–Hochberg method was used to correct for multiple testing. Solid lines show statistically significant associations, while dashed lines show non-significant trends. Shaded areas show 95% confidence intervals. Key for dots in A and B—Red: Normal BMI (< 23 kg/m2), Green: Overweight (BMI 23.0 to < 27.5 kg/m2), Blue: Obese (BMI ≥ 27.5 kg/m2). Key for dots in C—Purple: non-GDM, Black: GDM. BH Benjamini–Hochberg, CI confidence interval, DG diacylglycerol, DHA docosahexaenoic acid, GDM gestational diabetes, LPC lyso-phosphatidylcholine, LPE lyso-phosphatidylethanolamine, PC phosphatidylcholine, PE-P phosphatidylethanolamine-plasmalogen, TG triacylglycerol

