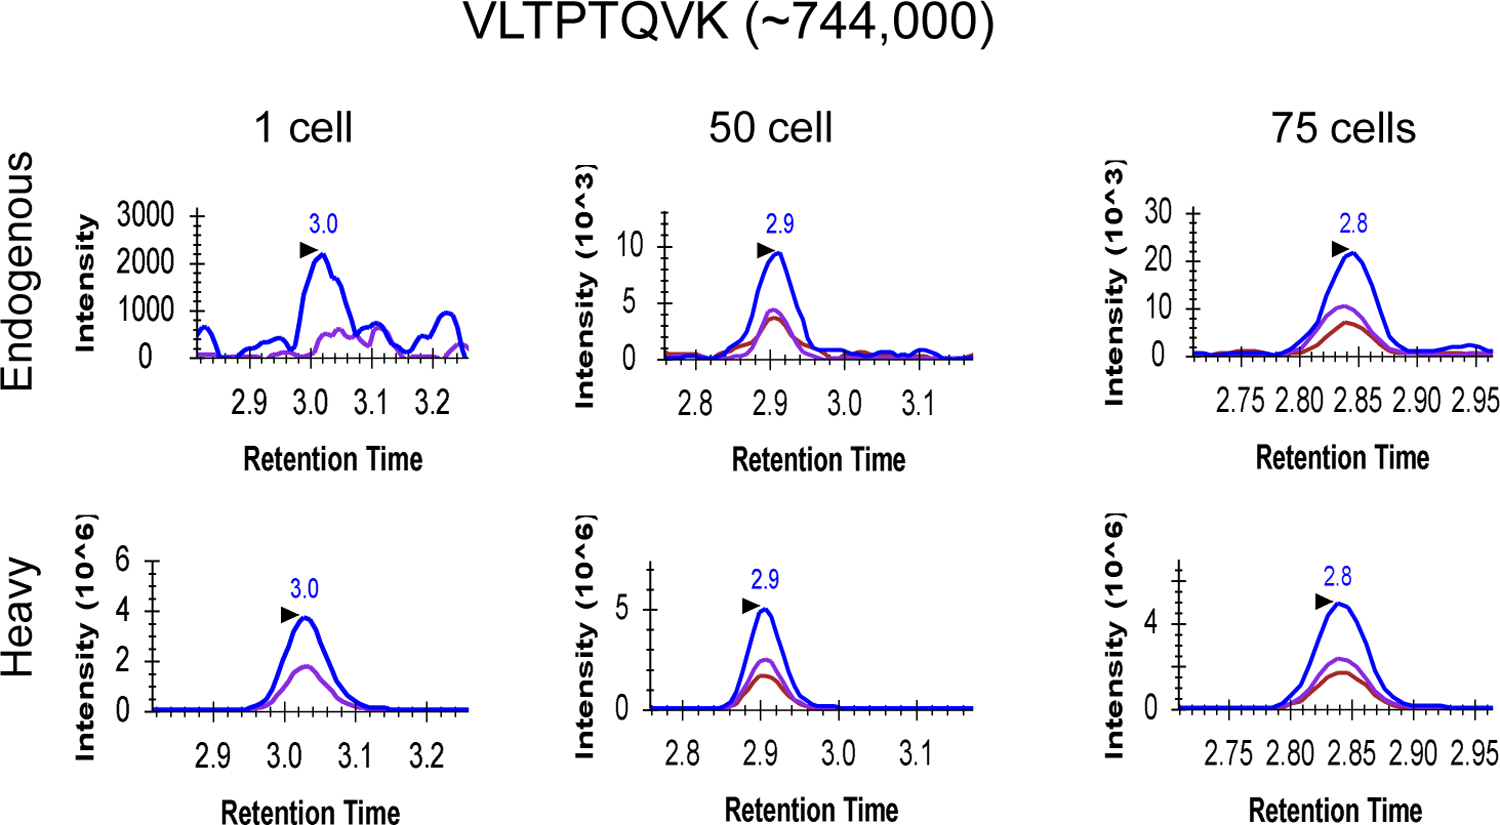
Figure 3: An example of targeted proteomics analysis of small numbers of MCF10A cells including single cells with cLC-SRM at short LC gradient.

Comparison of SRM signal among 1, 50 and 75 MCF10A cells sorted by FACS. ~30 fmol of internal standard was added to each sample. XICs of transitions monitored for VLTPTQVK derived from PEBP1: 443.3/673.4 (blue), 443.3/572.3 (purple), 443.3/213.2 (chestnut). For single cells, the transition 443.3/213.2 was removed due to severe matrix interference.
