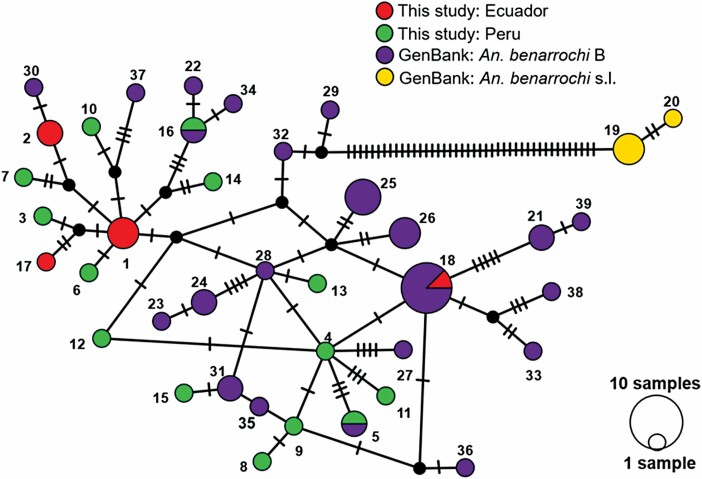
Fig. 2.
Median-joining COI (598-bp) haplotype network (epsilon = 0) for members of the Anopheles benarrochi complex from the current study and GenBank sequences (Supp Table 2 [online only]). Circles represent unique haplotypes and are colored based on species or sample origin (sequences from this study or GenBank). The size of each circle is proportional to the number of individual sequences sharing the haplotype. Black nodes indicate theoretical missing haplotypes, and hash marks represent mutation steps between haplotypes.

