
Figure 4. Halicin dissipates the ∆pH component of the proton motive force.
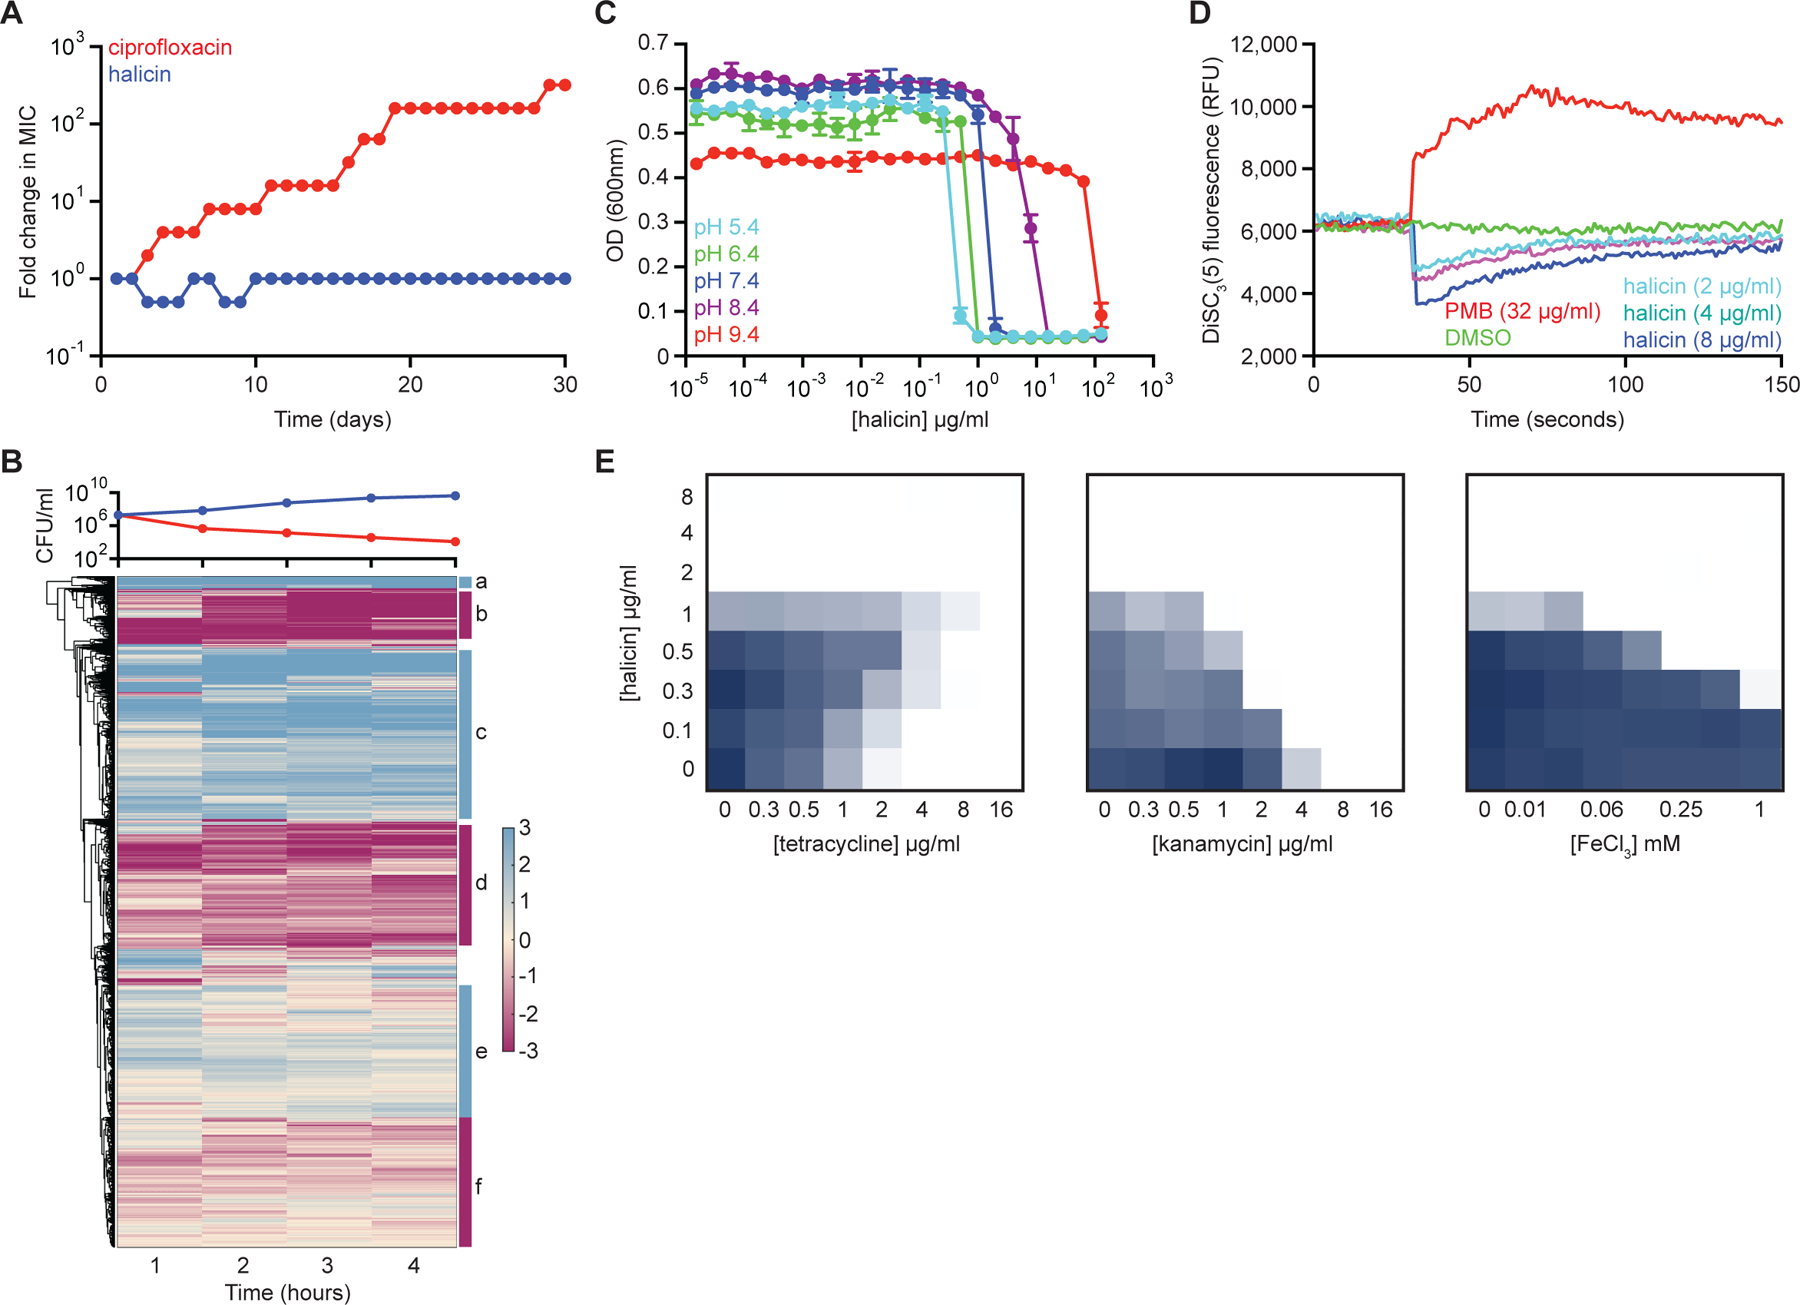
(A) Evolution of resistance to halicin (blue) or ciprofloxacin (red) in E. coli after 30 days of passaging in liquid LB media. Cells were passaged every 24 hours. (B) Whole transcriptome hierarchical clustering of relative gene expression of E. coli treated with halicin at 4x MIC for 1 hr, 2 hr, 3 hr, and 4 hr. Shown is the mean transcript abundance of two biological replicates of halicin-treated cells relative to untreated control cells on a log2-fold scale. Genes enriched in cluster b are involved in locomotion (p~10−20); genes enriched in cluster c are involved in ribosome structure/function (p~10−30); and genes enriched in cluster d are involved in membrane protein complexes (p~10−15). Clusters a, e, and f are not highly enriched for specific biological functions. In the growth curve, blue represents untreated cells; red represents halicin-treated cells. (C) Growth inhibition by halicin against E. coli in pH-adjusted media. Shown is the mean of two biological replicates. Bars denote absolute error. (D) DiSC3(5) fluorescence in E. coli upon exposure to polymyxin B (PMB), halicin, or DMSO. Growth inhibition checkerboards of halicin in combination with tetracycline (left), kanamycin (center), and FeCl3 (right). Dark blue represents greater growth. See also Figure S3, Table S4.