Figure 4.
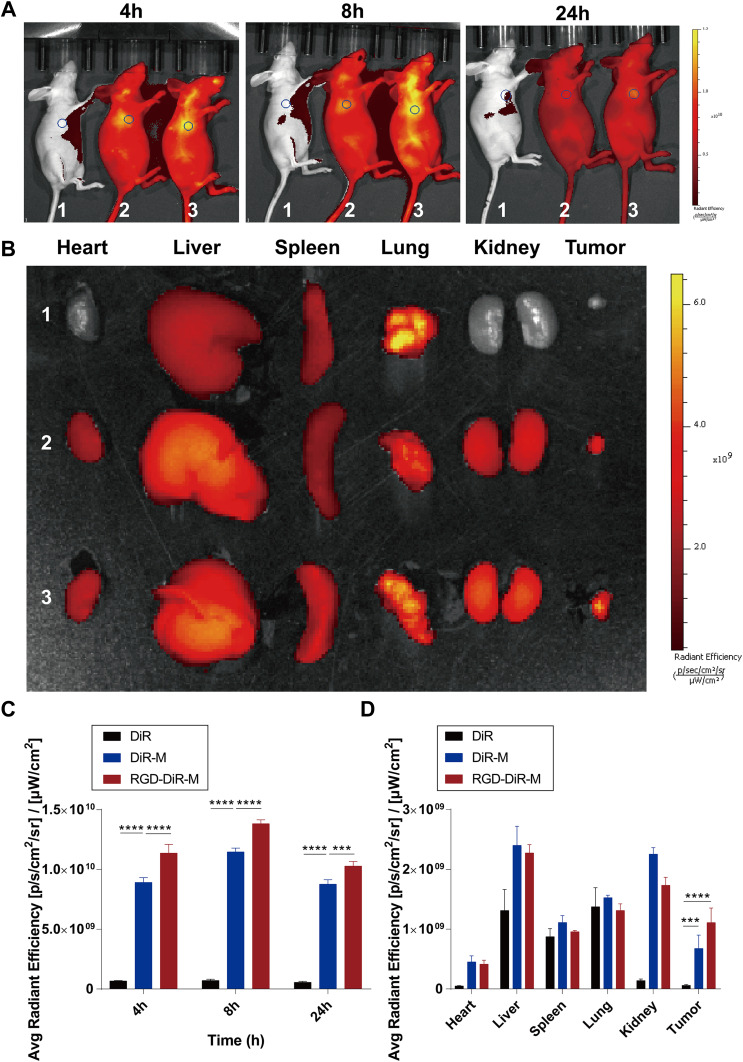
In vivo biodistribution of free DiR (1), DiR-M (2) and RGD-DiR-M (3). In vivo fluorescence images of the tumor-bearing mice after intravenous injection at 4, 8, and 24 hours post injection (A); fluorescence images of ex vivo main organs and tumors at 24 hours post injection (B); the quantitative analysis of fluorescence intensity in tumors at 4, 8, and 24 hours post injection (C); the quantitative analysis of fluorescence intensity in ex vivo mean organs and tumors (D) (n=4, ***p<0.001, ****p<0.0001).

