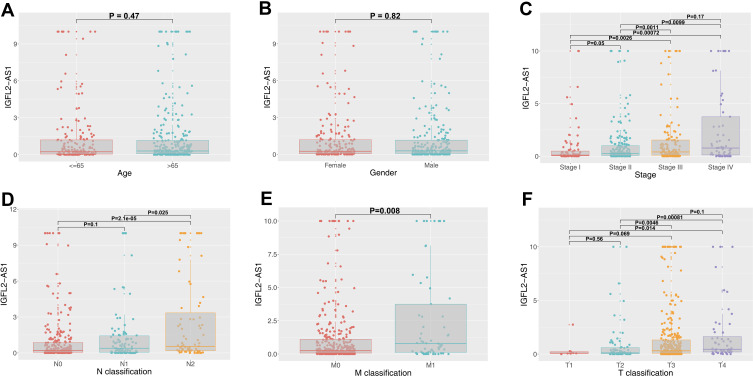
Figure 2.
Clinical correlation of IGFL2-AS1.
Notes: (A) The expression value of IGFL2-AS1 in different age groups (≤65 and >65); (B) The expression value of IGFL2-AS1 in male and female groups; (C) The expression value of IGFL2-AS1 in different clinical-stage group (Stage I, Stage II, Stage III and Stage IV); (D) The expression value of IGFL2-AS1 in different N classification groups (N0, N1 and N2); (E) The expression value of IGFL2-AS1 in different M classification groups (M0 and M1); (F) The expression value of IGFL2-AS1 in different T classification groups (T1, T2, T3 and T4).

