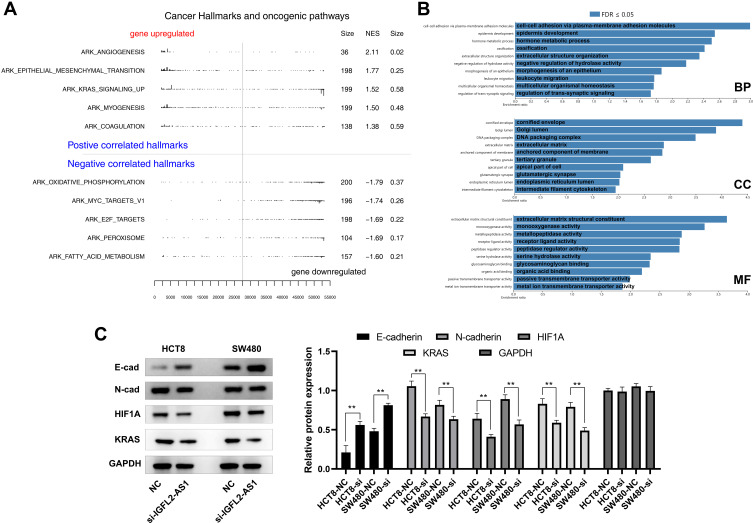
Figure 6.
GSEA pathway enrichment analysis of IGFL2-AS1.
Notes: (A) GSEA analysis to explore the biological pathway IGFL2-AS1 involved in (the upper part were the pathways up-regulated in the IGFL2-AS1 high expression patients, the lower part were the pathways down-regulated in the IGFL2-AS1 high expression patients); (B) GO analysis of IGFL2-AS1 with FDR ≤0.05 (three part, BP, biological process; CC, cellular component and MF, molecular function); (C) Western blot of E-cad, N-Cad, HIF1A, KRAS and GAPDH in control and IGFL2-AS1 knockdown cells, *P<0.05, **P<0.01.
Abbreviations: GSEA, gene set enrichment analysis; GO, gene ontology.

