Fig. 4.
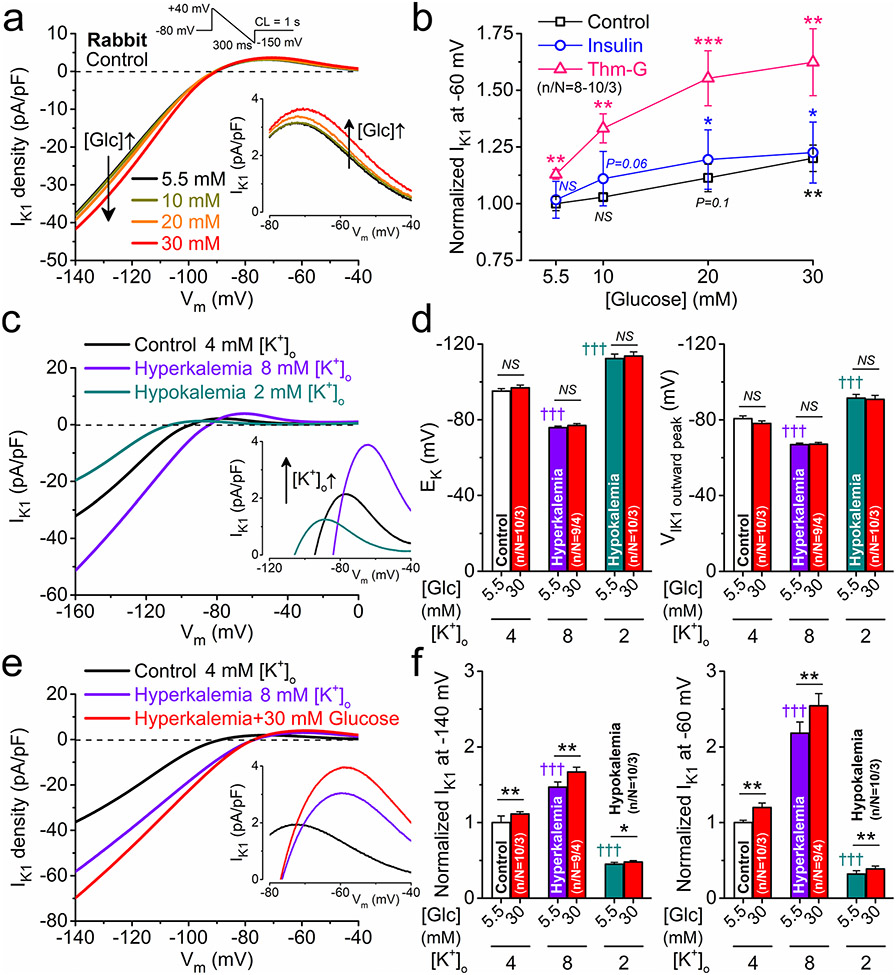
Glucose dose-response on IK1 and effect of changing extracellular K+ concentration. a Representative IK1 traces measured using a ramp protocol (shown above) in the presence of increasing concentrations of glucose in rabbit ventricular myocytes. b Glucose dose–response curves on IK1 at – 60 mV in control and following pretreatments with either insulin (5 nmol/L) or Thiamet-G (Thm-G, 100 nmol/L). c Representative IK1 traces in hyperkalemia and hypokalemia. d Hyperkalemia and hypokalemia shifted the reversal potential of IK1 (EK) and the voltage, where outward IK1 peaked. e Representative IK1 traces in combined hyperkalemia and hyperglycemia. f Hyperglycemia markedly increased IK1 in hyperkalemia and slightly increased in hypokalemia. Two-way ANOVA; *p < 0.05, **p < 0.01, ***p < 0.001 vs. normoglycemia; †††p < 0.001 vs. control

