Figure 1.

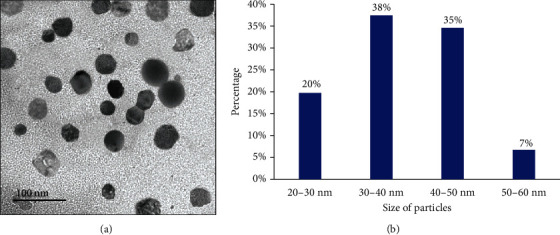
(a) Photomicrographs of the transmission electron microscope of nanocurcumin particles showing their average diameters. (b) Histogram represents the relation between nanocurcumin size and the count %.

(a) Photomicrographs of the transmission electron microscope of nanocurcumin particles showing their average diameters. (b) Histogram represents the relation between nanocurcumin size and the count %.