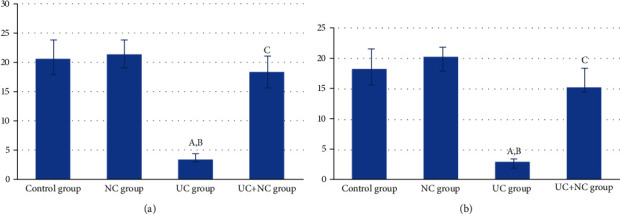
Figure 8.

(a) Analysis of the number of CD 34 positive immune-stained TC/HPF in the study groups (6 rats/group). A: significant difference in relation to control group. B: significant difference in relation to NC group. C: significant difference in relation to UC group. (b) Analysis of the vimentin-positive immune-stained cells TC/HPF in the study groups (6 rats/group). A: significant difference in relation to control group. B: significant difference in relation to NC group. C: significant difference in relation to UC group.
