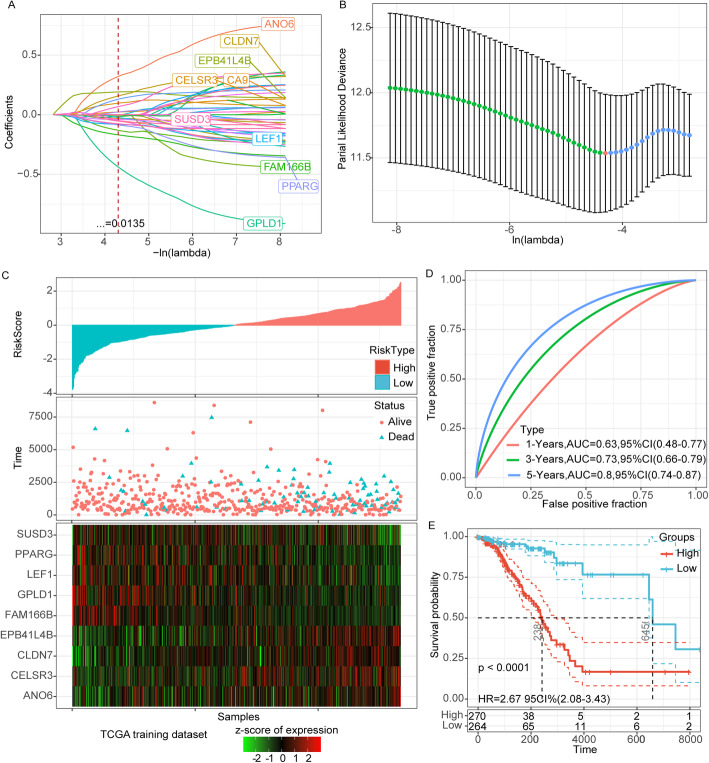
Fig. 3.
Establishment of CNV related genes prognostic model. a: The change trajectory of each independent variable, the horizontal axis represents the log value of the independent variable lambda, and the vertical axis represents the coefficient of the independent variable. b: The confidence interval under each lambda. c: RiskScore distribution, survival time and survival status and 9-gene expression in the TCGA training set. d: ROC curve and AUC of 9-gene signature in the TCGA training set. e: KM survival curve of 9-gene signature in the TCGA training set

