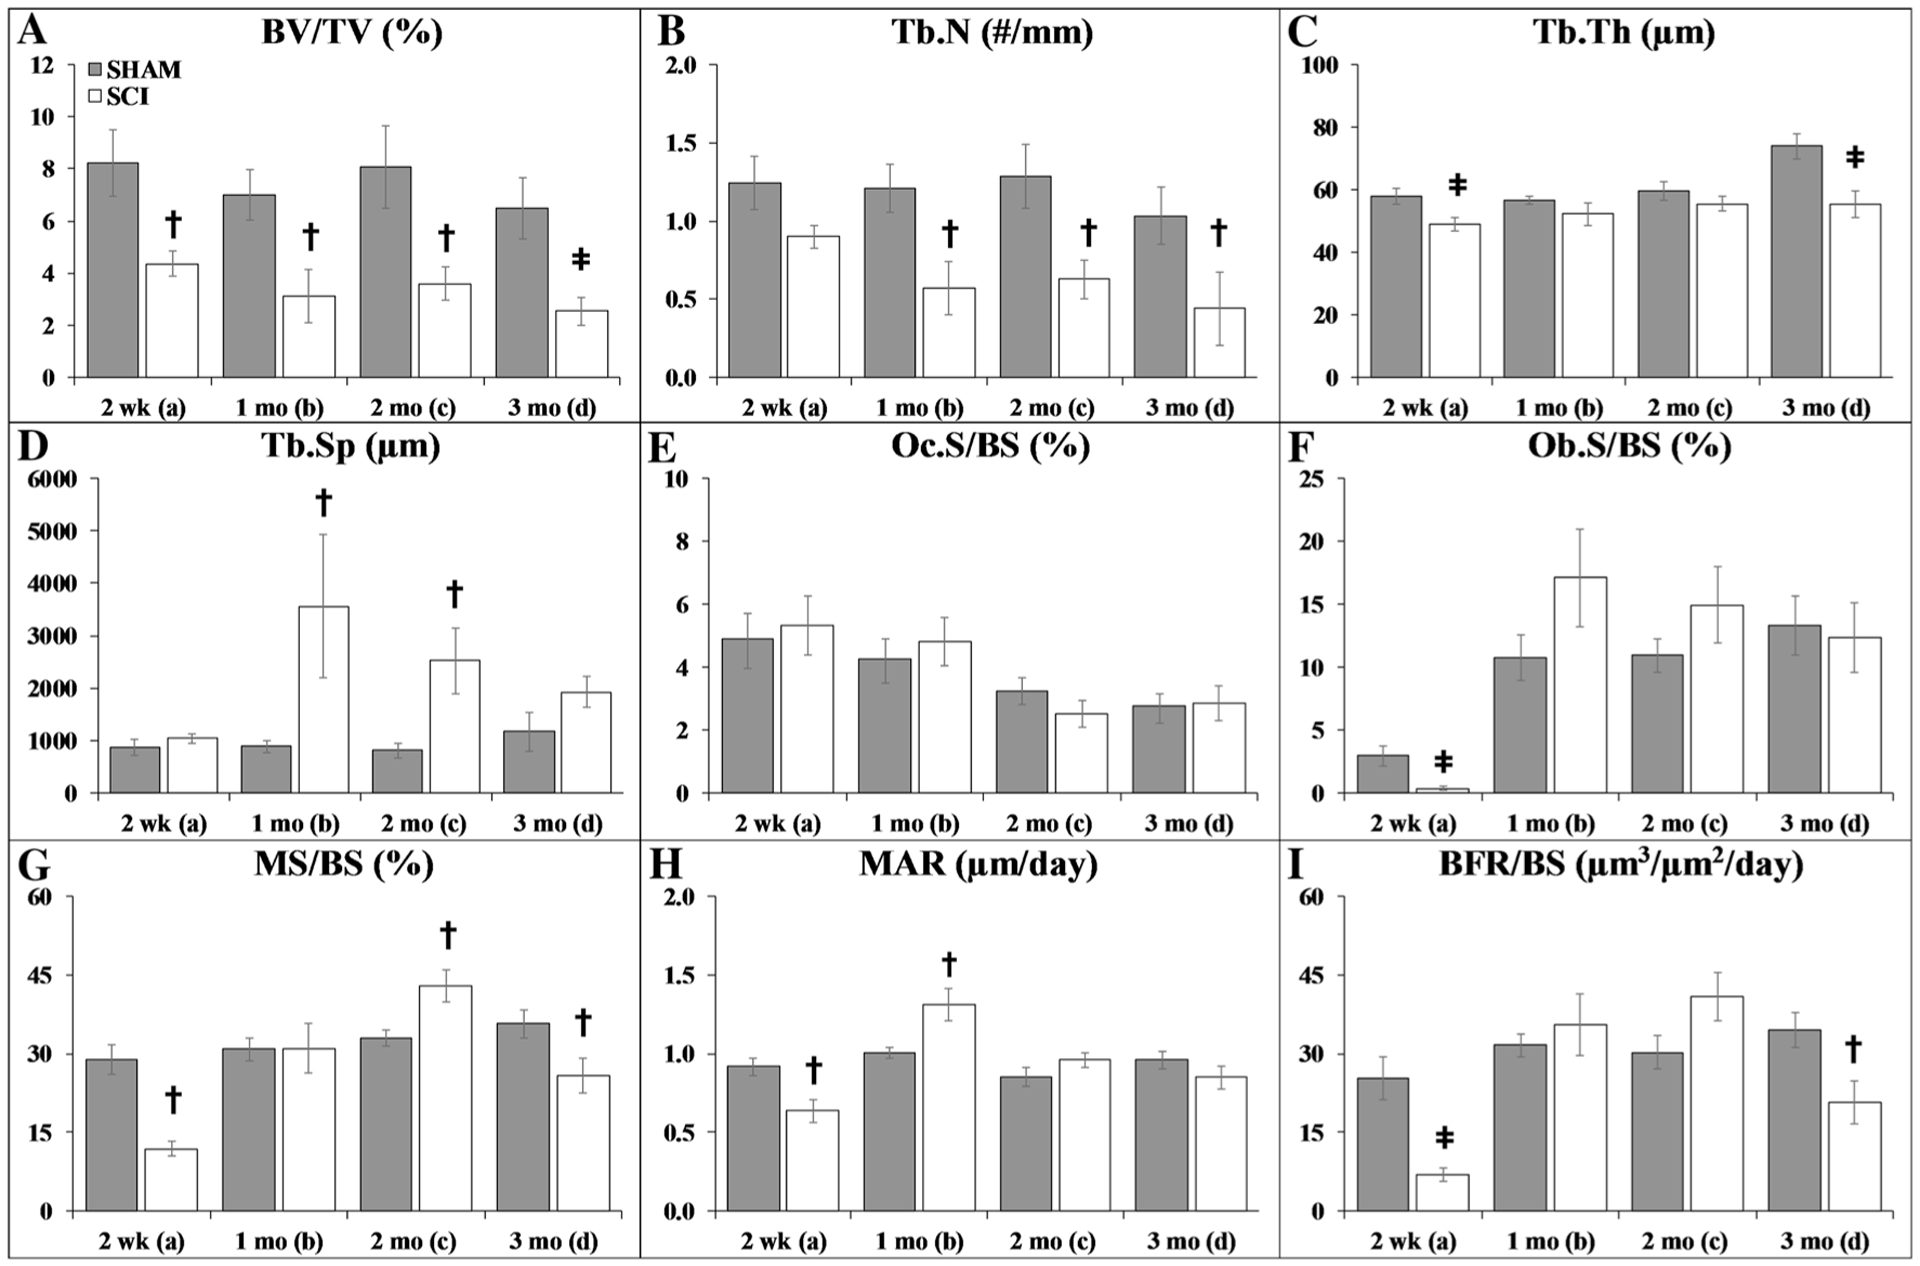
Fig. 1.

a–i Cancellous histomorphometric outcomes at the proximal tibial metaphysis. Values are means ± SEM, n = 8–15/group at each timepoint. Dagger indicates p < 0.05 and ǂ indicates p < 0.01 for SHAM versus SCI at the same time point derived from t-tests. Main effects and interactions derived from the 2 × 4 ANOVAs are reported in Online Resource 4
