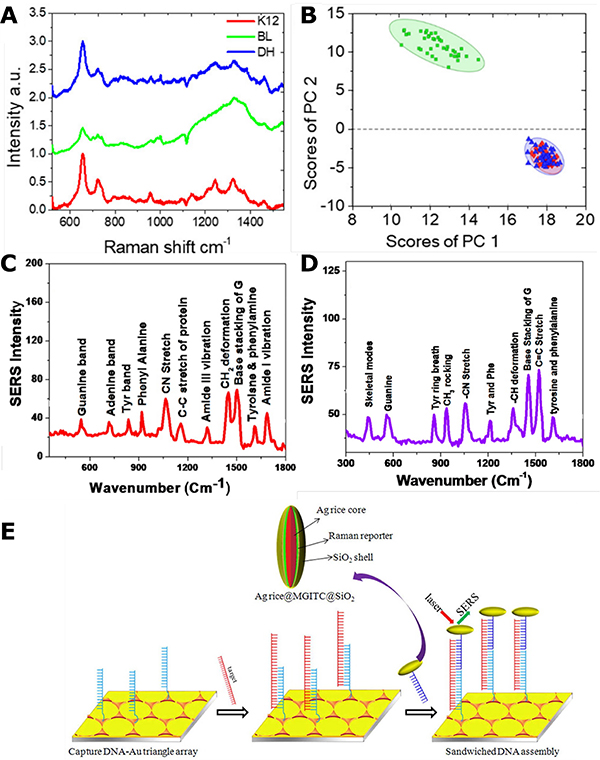
Figure 15. SERS Sensing of Microbial Pathogens.
(A-B) Average normalized SERS spectra (A) and principal component analysis with 95% confidential ring (B) of E. coli K12 (red), E. coli DH 5α E (blue) and E. coli BL21 (DE3) (green). Reprinted with permission from Ref. 224. Copyright (2018) American Chemical Society.
(C-D) SERS spectra of mosquito-borne flaviviruses WNV (C) and DENV (D). Reprinted with permission from Ref. 236. Copyright (2015) American Chemical Society.
(E) Scheme of structure of Ag nanorice@MGITC@SiO2 as SERS sensor for HBV DNA. Reprinted with permission from Ref. 239. Copyright (2013) American Chemical Society.

