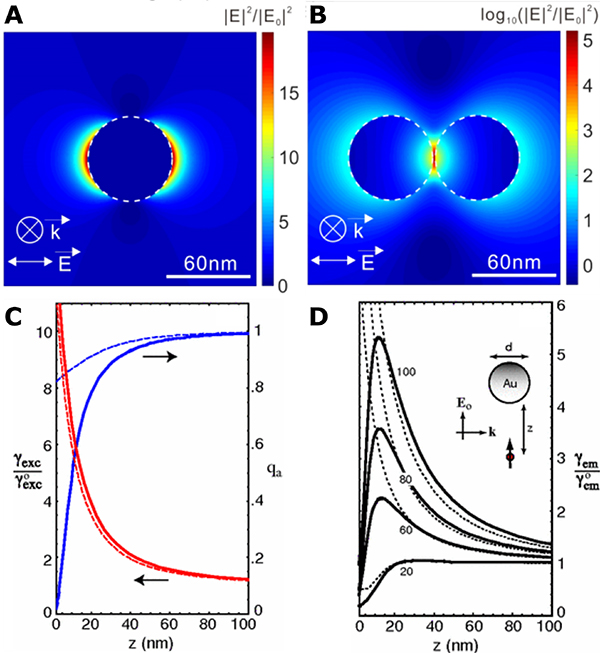
Figure 4. Plasmonic E-Field Generation and Enhancement of Molecular Excitation and Emissions.
(A, B) Calculated E-field intensity maps for a 60 nm Au NP monomer (A) and dimer (B). Reproduced from Ref. 35. © IOP Publishing. Reproduced with permission. All rights reserved.
(C, D) Calculated quantum yield qa, excitation rate γexc and fluorescence emission rate γem normalized with free-space values as a function of fluorophore-metal separation for 80 nm Au NPs (C) and Au NPs with various diameters (D). Solid curves: MMP calculations, dashed curves: dipole approximation. Reprinted figures with permission from [Anger, P.; Bharadwaj, P.; Novotny, L. Physical review letters 96, 113002, 2006. https://doi.org/10.1103/PhysRevLett.96.113002]. Copyright (2006) by the American Physical Society.

