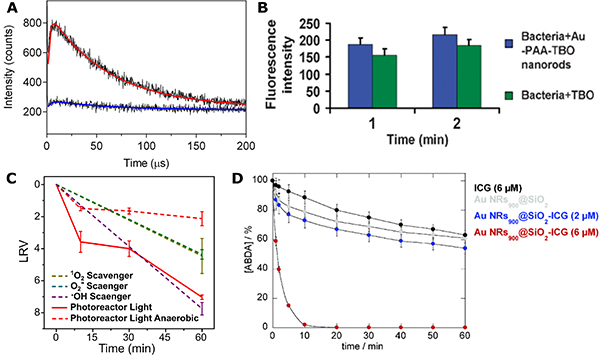
Figure 8. Evidence for ROS Generation in PDCT.
(A) Time-resolved luminescence of 1O2 and biexponential fits at 1275 nm for hybrid plasmonic nanoparticles (red) and an etched control (blue). Reprinted with permission from Ref. 97. Copyright (2016) American Chemical Society.
(B) Fluorescence intensity of singlet oxygen sensor green staining for MRSA treated with Au NRs-TBO system or just with TBO for 1 or 2 min. Reproduced from Ref. 119 with permission from The Royal Society of Chemistry.
(C) Inactivation curves for Ag-[Ru(bpy)3]2+ photoreactor system without (red, solid) or with different ROS scavengers (dashed). Reprinted with permission from Ref. 118. Copyright (2020) American Chemical Society.
(D) ABDA degradation curve with Au NRs@SiO2 nanocomposites incorporating various concentrations of indocyanine green. Reproduced from Ref. 84 with permission from The Royal Society of Chemistry.

