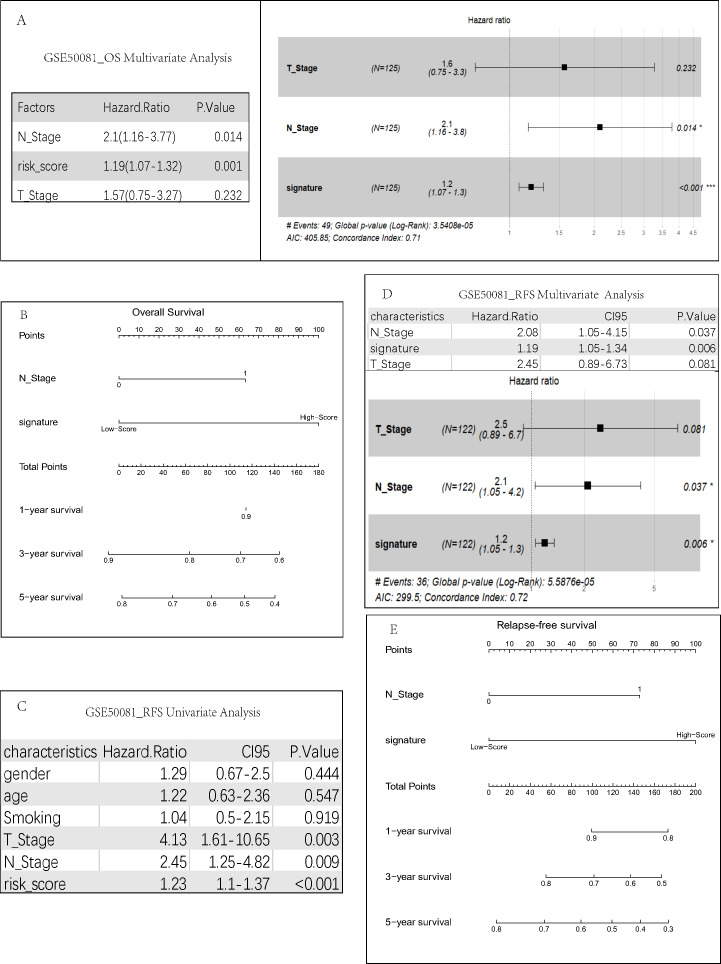
Figure 4. Construction of risk prediction model.
(A) Multivariate regression analysis of clinical parameters related to overall survival. For each patient, three lines are drawn upward to determine the points received from the three predictors in the nomogram. The sum of these points is located on the ‘Total Points’ axis. Then a line is drawn downward to determine the possibility of 1-, 3-, and 5-year OS (B)/RFS. (E) of LUAD. RFS-related univariate (C) and multivariate (D) regression analyses were performed to screen for independent relapse clinical parameters.

