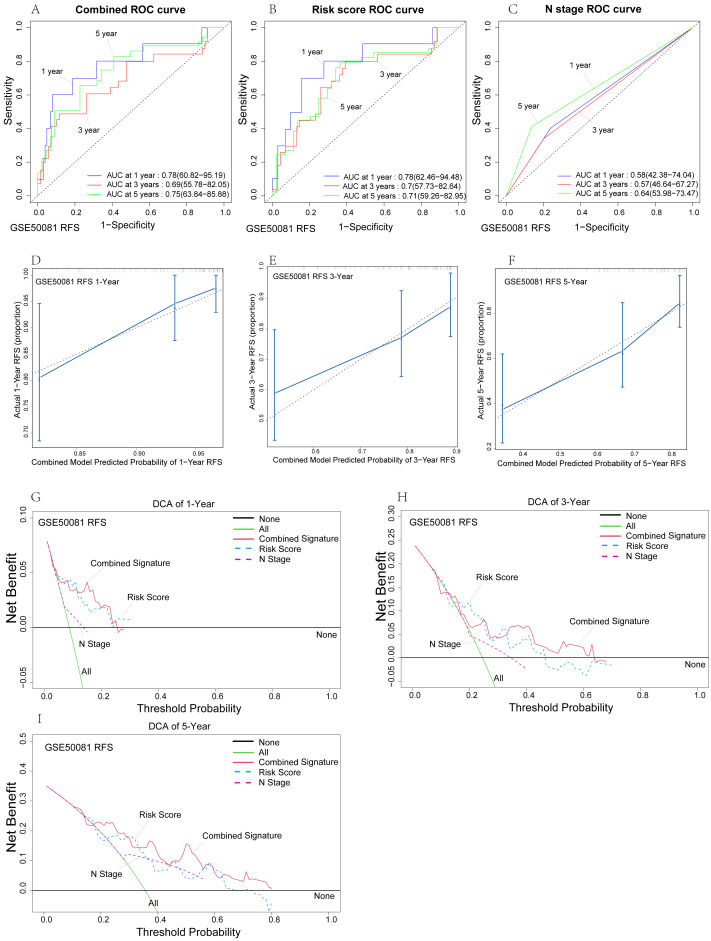
Figure 6. Internal validation of risk prediction models.
(A–C) Time-dependent ROC curves of the nomogram of 1-, 3- and 5-year RFS for univariate model and combined model to evaluate the predictive performance. (D–F) The calibration plot for internal validation of the nomogram. (G–I) DCA curves of the univariate model and combined model for 1-,3- and 5-year RFS in LUAD to evaluatethe clinical decision-making benefts.

