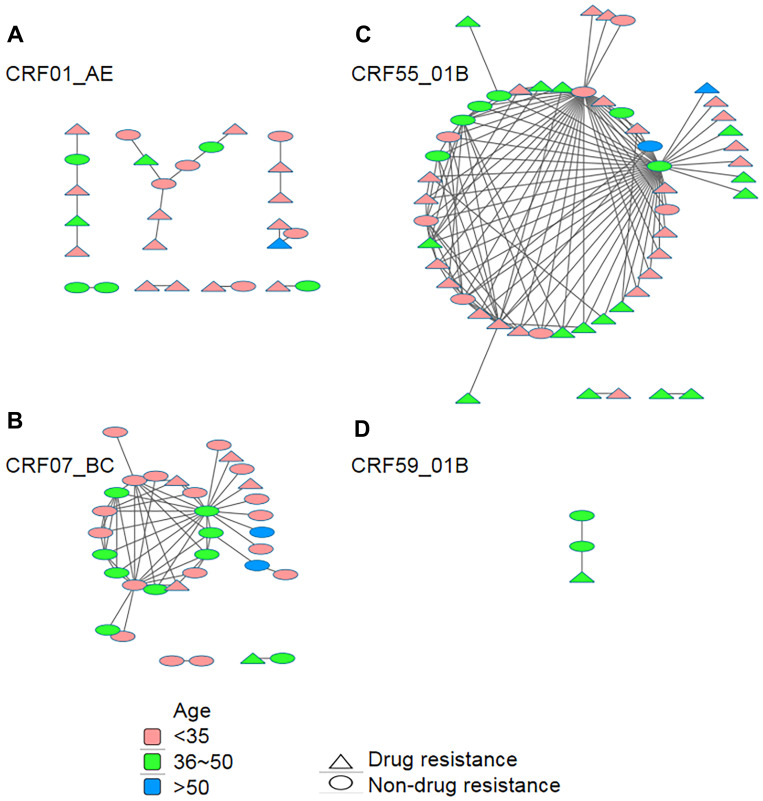
Figure 2.
Age- and drug-resistance-associated genetic transmission networks of different genotype sequences. The networks were constructed using Cytoscape with a pairwise genetic distance analysed by using HyPhy software. A total of 27 CRF01_AE sequences (A), 33 CRF07_BC sequences (B), 52 CRF55_01B sequences (C), and 3 CRF59_01B sequences (D) were used for genetic transmission network analysis, and the largest cluster had 48 sequences. Different colours and shapes represent sequences from different age groups or those showing drug resistance or not, respectively.

