Fig. 3.
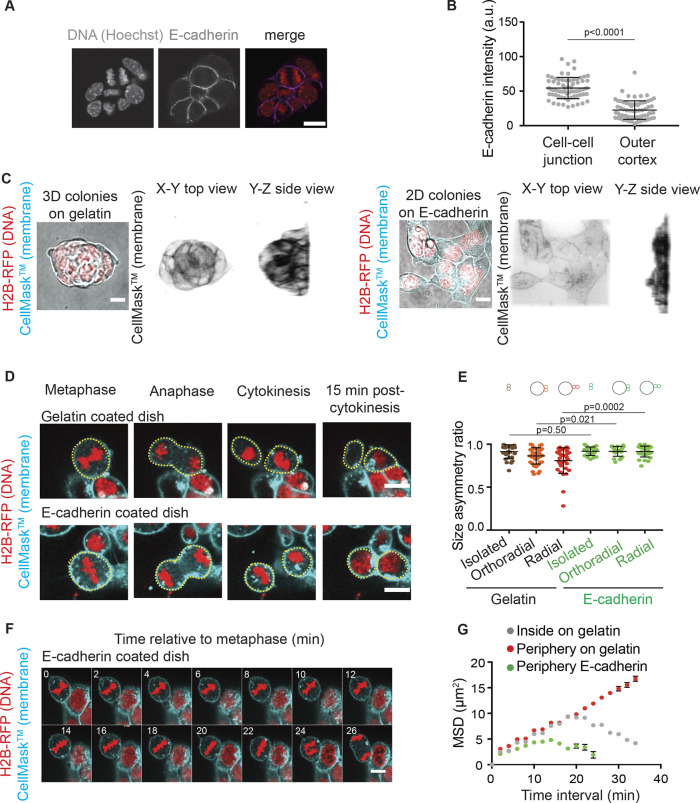
E-cadherin heterogeneities correlate with size asymmetries at division in ESCs. (A) Representative confocal images of ESCs stained for E-cadherin and DNA. Scale bar: 10 µm. (B) Dot plot showing the intensity levels of E-cadherin staining in H2B–RFP ESCs, at cell–cell junctions and at cell borders exposed to the outside of the colony (outer cortex). The mean±s.d. are shown (N=2). (C) Representative images of colonies of ESCs expressing H2B–RFP (red) and labeled with CellMask™ Deep Red (cyan) on a gelatin-coated substrate (left), and an E-cadherin-coated substrate (right). A Z-projection overlaid on a transmitted light image is shown on the left and 3D renditions of a top view (XY, middle) and a side view (YZ, right) are shown on the right. Scale bars: 10 µm. (D) Representative time-lapse images of dividing ESCs expressing H2B–RFP (red) and labeled with CellMask™ Deep Red (cyan) on a gelatin-coated substrate (top) and on an E-cadherin-coated substrate (bottom). One Z-plane is shown. Cell boundaries are highlighted with yellow dotted line. Scale bars: 10 µm. (E) Dot plot representing the size asymmetry ratio between daughter cells at division for ESCs plated on E-cadherin and dividing as single cells (‘isolated’) or at the periphery of a colony with the spindle oriented orthoradially or radially to the colony border. The control data for cells on gelatin from Fig. 1C,D is plotted for reference. The mean±s.d. are shown (N=2). (F) Representative time-lapse spinning-disk confocal microscopy images of a H2B–RFP (red) expressing ESC colony labeled with CellMask™ Deep Red (cyan) plated on E-cadherin with one cell dividing at the periphery of the colony. 0 min corresponds to metaphase. One Z plane is shown. Scale bar: 10 µm. (G) Graph showing the 3D mean square displacement of the center of the metaphase plate (see Materials and Methods section) for ESCs plated on E-cadherin and dividing at the periphery of the colony (green) as a function of time interval. The mean±s.e.m. are shown (N=2, n=15). The data corresponding to cells on gelatin from Fig. 2C are plotted in gray and red for reference. 0 min represents anaphase. P-values were calculated with a Mann–Whitney test (B,E) or Student's t-test (E, radial). a.u., arbitrary units.

