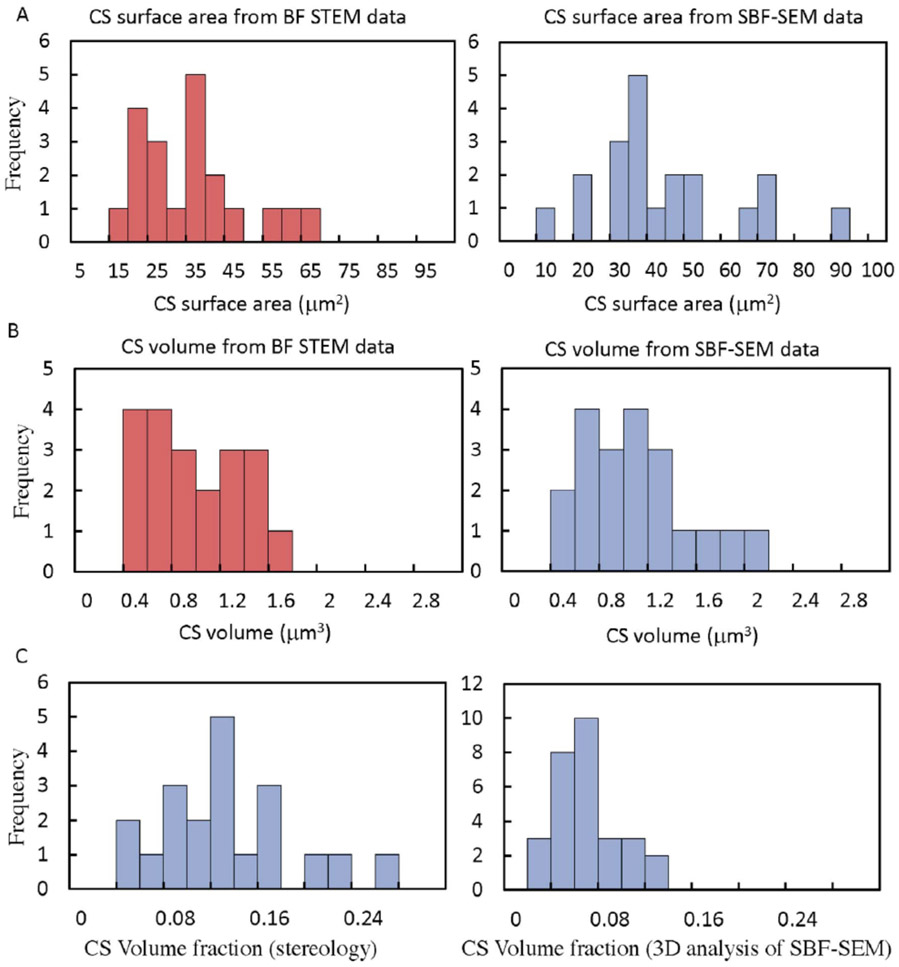
Figure 8.
Histogram of stereological measurements on 20 random cross sections through platelets obtained from STEM tomography and SBF-SEM datasets: (A) shows use of stereological approach for calculating the CS surface area per platelet from STEM tomography data (red plot), and from SBF-SEM data (blue plot); (B) shows use of stereological approach for calculating the CS volume per platelet from STEM tomography data (red plot), and from SBF-SEM data (blue plot); (C) compares determination of the platelet CS volume fraction using stereological measurements on the SBF-SEM dataset (plot on left), and using 3D analysis of the segmented CS compartments in the same dataset (plot on right).

