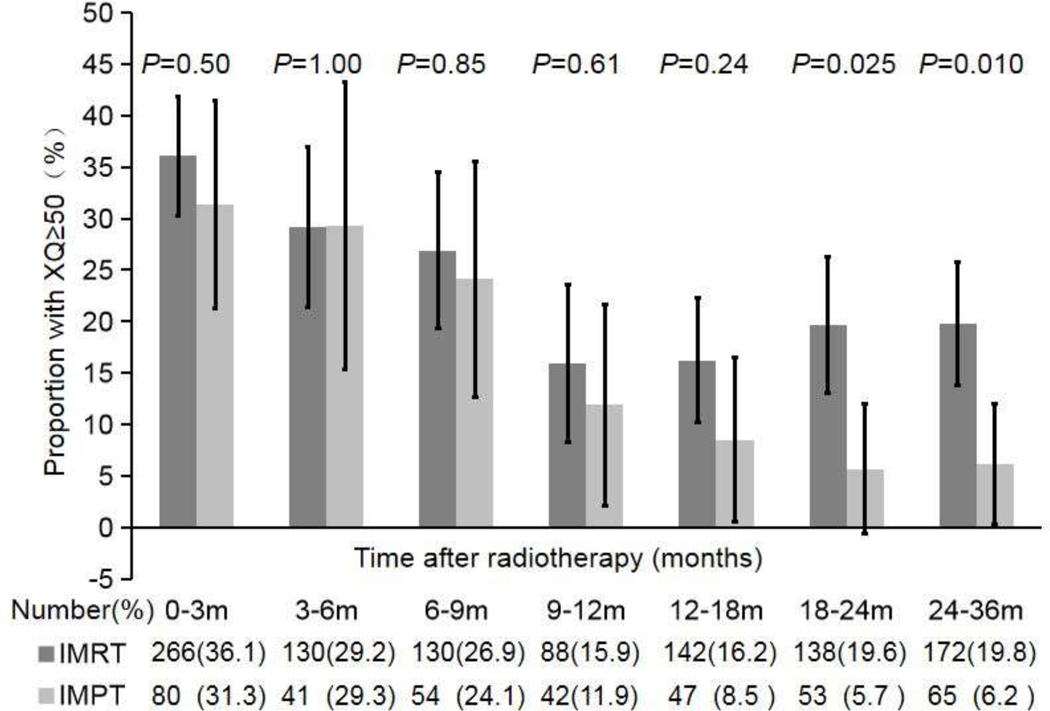
Fig. 1.
The proportions of patients with moderate-severe xerostomia (XQs ≥50) in both treatment groups (IMRT and IMPT) at the indicated times after treatment. The total numbers of patients in each group are shown under the graph. The p values are for comparison of the proportions of patients with moderate-severe xerostomia in the two groups (chi-square test). The error bars indicate 95% confidence intervals.

