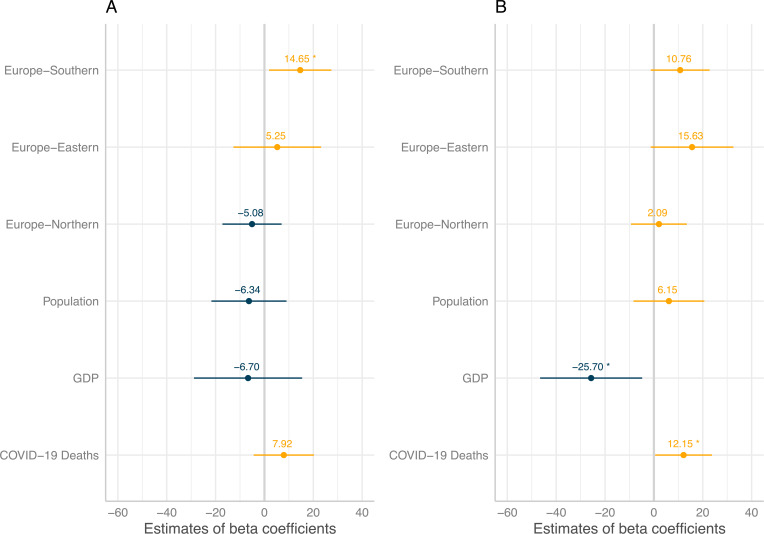
Figure 4.
Multivariable models for the reduction in procedure volume at centres from March 2019 to (A) March 2020 and (B) April 2020. Population, GDP and COVID-19 deaths were log transformed for analysis (log10). Graphs show estimate of the beta coefficients and SE. * indicates a p value of <0.05. European regions were compared with Western Europe as the baseline. GDP, gross domestic product.

