FIGURE 3.

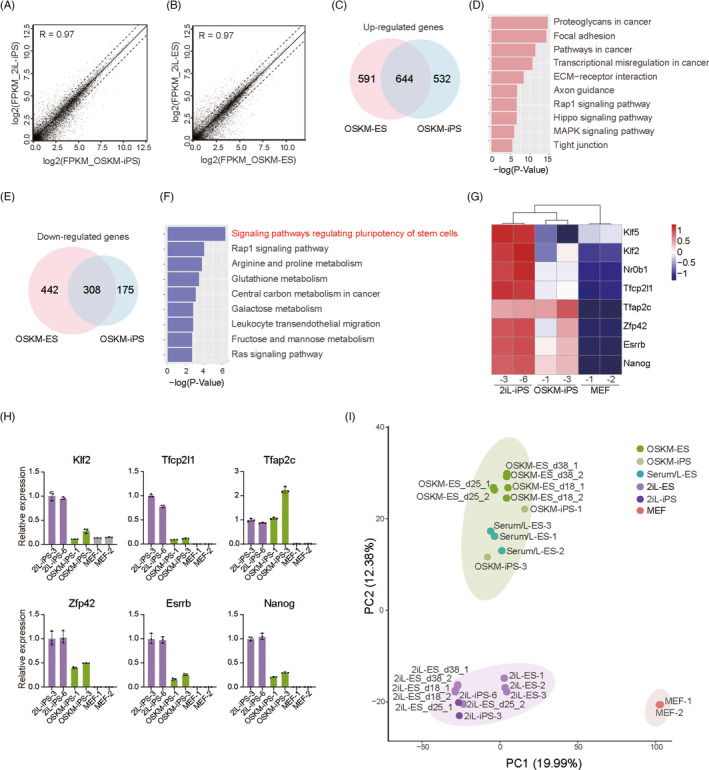
Gene expression patterns of OSKM‐iPSCs and OSKM‐ESCs. A, Gene expression comparison of OSKM‐iPSCs and 2iL‐iPSCs shown in the scatterplot; n = 2. The correlation coefficient (R) was determined by Pearson's correlation. B, Gene expression comparison of OSKM‐ESCs (day 38) and 2iL‐ESCs (day 38) shown in the scatterplot; n = 2. Correlation coefficient (R) was determined by Pearson's correlation. C, Venn diagram showing the numbers of upregulated genes in OSKM‐ESCs when compared to 2iL‐ESCs (left) and in OSKM‐iPSCs when compared to 2iL‐iPSCs (right). Fold change >2, P < .05; 644 genes were commonly upregulated in both comparisons. D, Enriched KEGG pathways of above 644 commonly up‐regulated genes. E, Venn diagram showing the numbers of downregulated genes in OSKM‐ESCs when compared to 2iL‐ESCs (left) and in OSKM‐iPSCs when compared to 2iL‐iPSCs (right), fold change >2, P < .05; 308 genes were commonly downregulated in both comparisons. F, Enriched KEGG pathways of above 308 commonly downregulated genes. G, Heatmap of expression levels of naïve pluripotency genes in 2iL‐iPSCs, OSKM‐iPSCs, and MEF cells. H, Relative expression levels of naïve pluripotency genes measured by real‐time quantitative PCR in 2iL‐iPSCs, OSKM‐iPSCs, and MEF cells. I, Principal‐component analysis for gene expression of all related samples. PC1 and PC2 represented the top two principal components. Serum/L represented serum with LIF
