FIGURE 3.

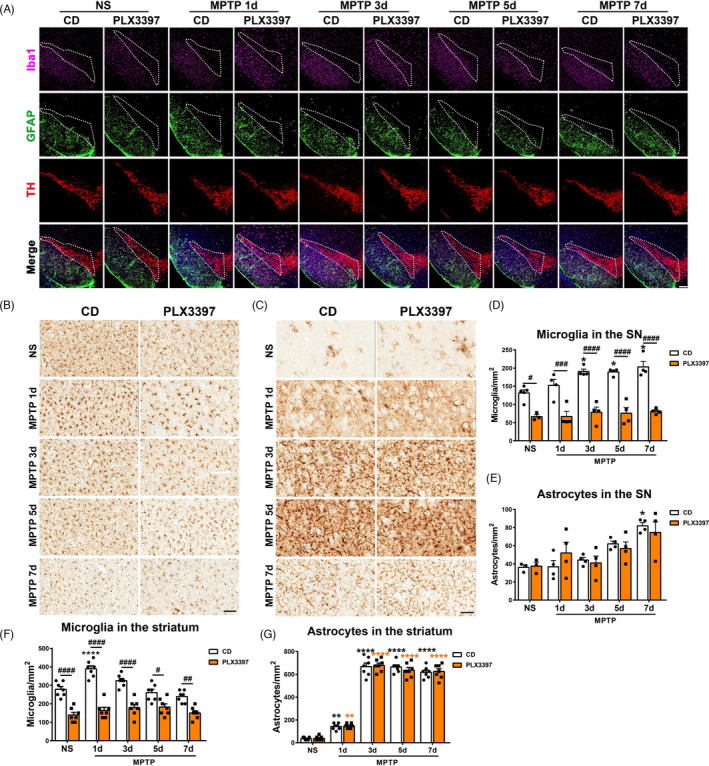
Analysis of microgliaand astrocytes in nigrostriatal pathway of mice with partial microglialdepletion after MPTP administration. (A) Immunofluorescencestaining of Iba1+ (pink), GFAP+ (green) and TH+(red) in the SNpc. Scale bars: 200 μm. (B,C) Immunohistochemical staining showing Iba1+ (B) and GFAP+ (C) cells in the striatum.Scale bars: 100 μm. (D, E) Quantification of Iba1+ microglialcells (D) and GFAP+ astrocyticcells (E) in the SNpc. n=3‐6. (F, G) Quantification of Iba1+ microglial cells (F) and GFAP+ astrocytic cells (G) in the striatum. n=7. NS: normal saline; CD: control diet;PLX3397: PLX3397‐formulated diet. Two‐way ANOVA followed by Holm‐Sidak’smultiple comparisons test was used for statistical analysis. ** P<.01, *** P<.001, **** P<.0001, vs respective NS groups. # P<0.05, ## P<.01, ### P<.001, #### P<.0001, CD groups vs PLX3397 groups
