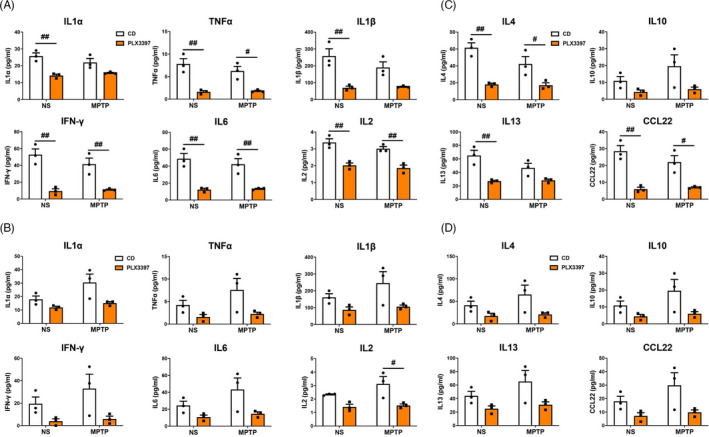
FIGURE 5.

Protein levels of pro‐inflammatory and anti‐inflammatory cytokines in the nigrostriatal pathway at 1 day after MPTP administration. (A) The expression of pro‐inflammatory cytokines IL1α, TNFα, IL1β, IFN‐γ, IL6 and IL2 in the SN. (B) The expression of pro‐inflammatory cytokines IL1α, TNF‐α, IL1β, IFN‐γ, IL6 and IL2 in the striatum. (C) The expression of anti‐inflammatory cytokines IL4, IL10, IL13 and CCL22 in the SN. (D) The expression of anti‐inflammatory cytokines IL4, IL10, IL13 and CCL22 in the striatum. NS: normal saline; CD: control diet; PLX3397: PLX3397‐formulated diet. Two‐way ANOVA followed by Holm‐Sidak’s multiple comparisons test was used for statistical analysis. # P < .05, ## P < .01, CD groups vs PLX3397 groups. n = 3
