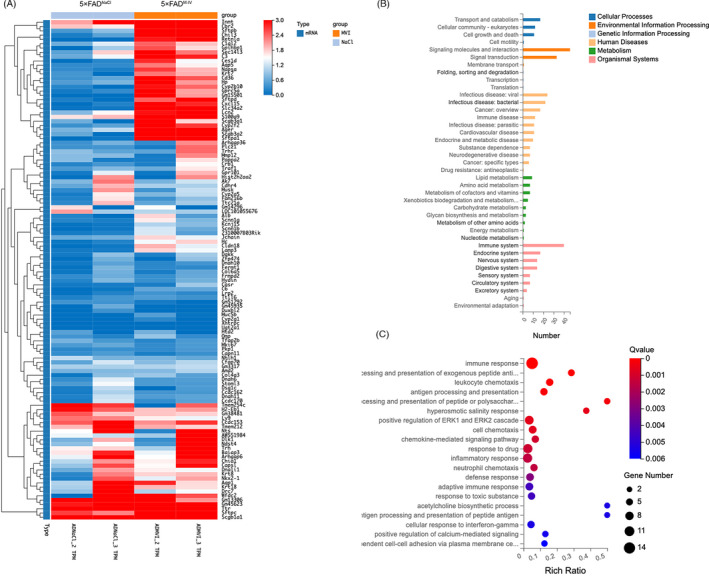
FIGURE 7.

RNA‐seq analysis of 5×FAD mice after immunity‐and‐matrix regulatory cell (IMRC) treatment identified the biological process associated with the immune response. (A), The expression profile of two distinct clusters of differentially expressed genes (DEGs) between IMRC‐treated and control mice. Colouring indicates the log2‐transformed fold change. (B), KEGG pathway analysis evaluated for the representative profiles of genes involved in Cellular Processes, Environmental Information Processing, Genetic Information Processing, Human Diseases and Organismal Systems. (C), GO enrichment analysis in biological process (*q < 0.05; **q < 0.01)
