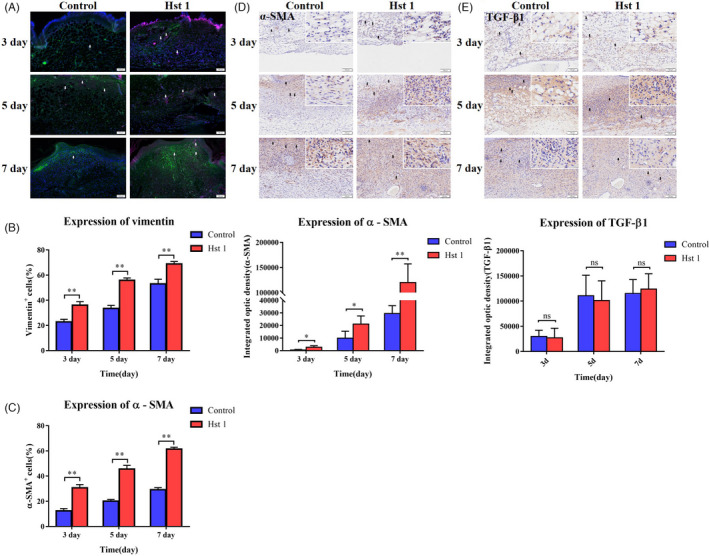
FIGURE 3.

Distribution of fibroblasts and related markers in wounds. A, Distribution of fibroblasts and myofibroblasts in wound. The wound sections were stained with immunofluorescence. DAPI was labelled blue fluorescence, vimentin was green and α‐SMA was purple. B, Percentage of fibroblasts in the wound, vertical axis, number of vimentin+ cells; horizontal axis, time. C, Percentage of myofibroblasts in the wound, vertical axis, number of α‐SMA+ cells; horizontal axis, time. D, Immunohistochemical staining of α‐SMA in wound sections and the optical density of each section was calculated by image analyser. Vertical axis, value of optical density; horizontal axis, time. E, Immunohistochemical staining of TGF‐β1 in wound sections. The optical density of each section was calculated by image analyser. Vertical axis, value of optical density; horizontal axis, time. Data are shown as mean ± SE. (*P < .05; **P < .01)
