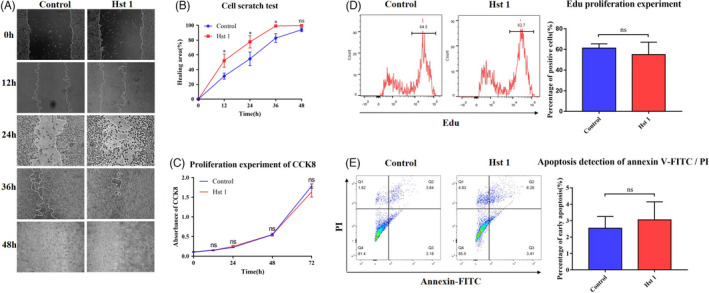
FIGURE 5.

Effect of Hst 1 on the characteristics of 3T3 cells. A, Migration experiment of 3T3 cells. The results of cell scratch test were photographed by light microscope. B, The area of uncured scratch was calculated by image analyser. C, Fibroblast viability test. CCK8 was used to test the viability in different groups, and the results were detected by spectrophotometer. Vertical axis, absorbance; horizontal axis, time. D, Detection of cell proliferation ability by Edu test. The expression of Edu in 3T3 cells was detected after treated with Hst 1 for 24 h, and the result showed non‐statistical difference. E, Apoptosis was detected by flow cytometry with Annexin V‐FITC/PI staining. Q2 represented the late apoptotic cells, Q3 for the early apoptotic cells and Q4 for living cells. The control group was cultured with complete DEME medium (10% FBS), and Hst 1 group was cultured with complete DEME medium (10% FBS) including 10 μmol/L Hst 1. Data are shown as mean ± SE. (*P < .05; **P < .01)
