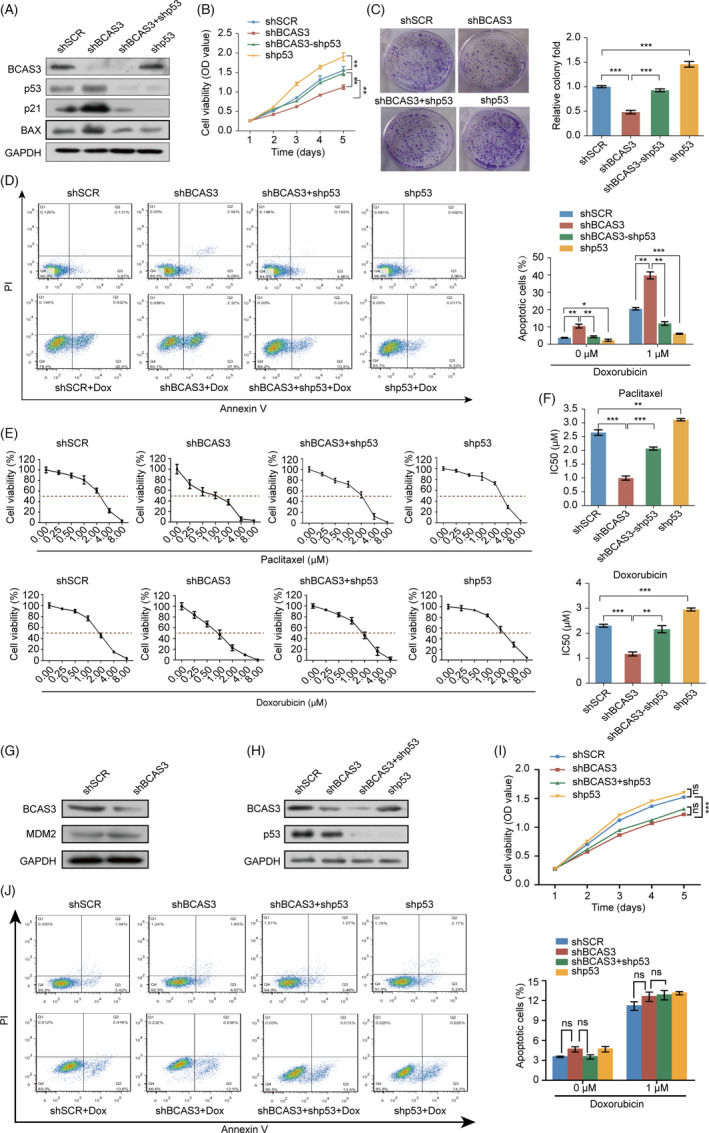
FIGURE 5.

The BCAS3‐p53 axis regulates cell growth, apoptosis and chemoresistance. (A). Construction of MCF‐7 stable cell line expressing the indicated lentiviruses and Western blot analysis of p53 target genes. (B). Cell viability detection of four models. The data are presented as means ± SD of three independent experiments. (C). The relative colony fold decreases in the BCAS3 knockdown model and restores in both BCAS3 and p53 knockdown cell models. (D). Detection of apoptosis rate in four cell model. Cells are treated with or without doxorubicin for 24 hours and detected for apoptosis rate in the indicated four models (Dox; 1 μmol/L). (E). MCF‐7 stable cell lines expressing the indicated lentiviruses are treated with the indicated doses of paclitaxel or doxorubicin. (F). IC50 of paclitaxel/doxorubicin in MCF‐7 cells transfected with control shRNA, BCAS3 shRNA, p53 shRNA or both BCAS3 shRNA and p53 shRNA. The IC50 values are obtained using CCK‐8 assay. Data are presented as the mean ± SD. *P < .05, **P < .01, ***P < .001. (G). MDM2 expression upon BCAS3 knockdown and p53 stabilization. Cellular extracts from MCF‐7 cells knocking down BCAS3 are subject to examine MDM2 protein expression levels. (H). Construction of MDA‐MB‐231 stable cell line expressing the indicated lentiviruses. (I). Cell viability is detected in four cell models of MDA‐MB‐231. The data are presented as means ± SD of three independent experiments. (J). Apoptosis rate is detected in four models of MDA‐MB‐231. Cells are treated with or without doxorubicin for 24 hours and detected for apoptosis rate in the indicated four models (Dox; 1 μmol/L)
