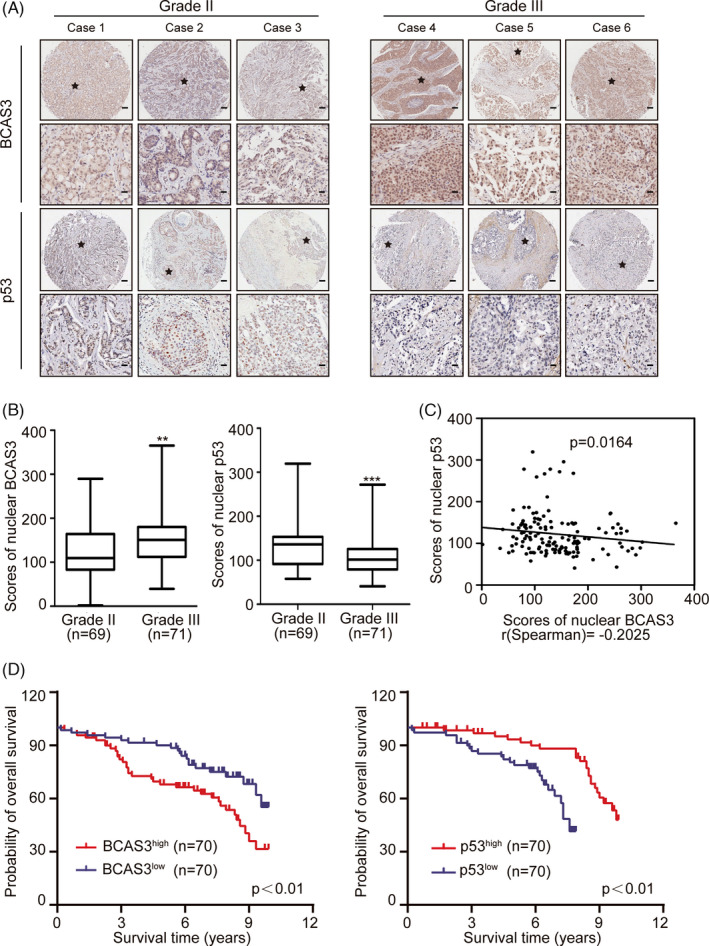
FIGURE 6.

BCAS3 and/or p53 correlates with poor prognosis. (A). Immunohistochemical staining of BCAS3 and p53 in tissue arrays containing 140 breast tumour samples (grade II: 69, grade III: 71). Representative image immunostaining with anti‐BCAS3 and anti‐p53 is presented. Scale Bars, 100 µm for ‘up’ and 25 µm for ‘down’. (B). Histoscores for BCAS3 and p53 staining in different grades. (C) Correlation between BCAS3 and p53 (n = 140, Spearman's correlation coefficient R and P‐value are shown). (D). Kaplan‐Meier curves of the OS in patients with BRCA. *P < .05, **P < .01, ***P < .001
