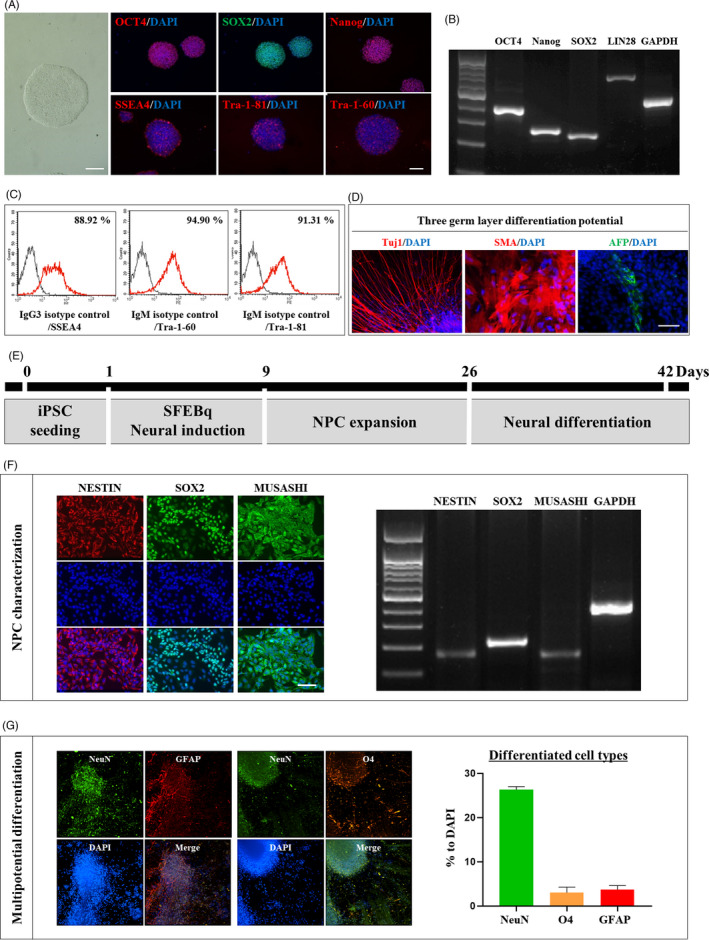
FIGURE 1.

Characterization and differentiation of HLA‐homozygous iPSC. (A) Immunostaining for OCT4, SOX2, Nanog, SSEA4, Tra‐1‐81 and Tra‐1‐60 showing the characterization of HLA‐iPSC. Scale bar: 100 μm. (B) HLA‐iPSC characterization by RT‐PCR. (C) HLA‐iPSC characterization by FACS analysis. (D) Immunostaining for Tuj1, SMA and AFP showing differentiation potential into the three germs layers. Scale bar: 50 μm. (E) Neuronal precursor cells (NPCs) generation method. (F) Immunostaining and RT‐PCR analyses for NESTIN, SOX2 and MUSASHI showing the characterization of the HLA‐iPSC‐NPCs. Scale bar: 50 μm. (G) Six weeks after differentiation, the ratio of differentiated cells was measured using IXMC analysis showing that HLA‐iPSC‐NPCs expressed markers for neurons (NeuN; 26.3 ± 0.69%), oligodendrocytes (O4; 3.0 ± 1.21%) and astrocytes (GFAP; 3.7 ± 0.94). Scale bar: 100 μm.
