
FIGURE 5.
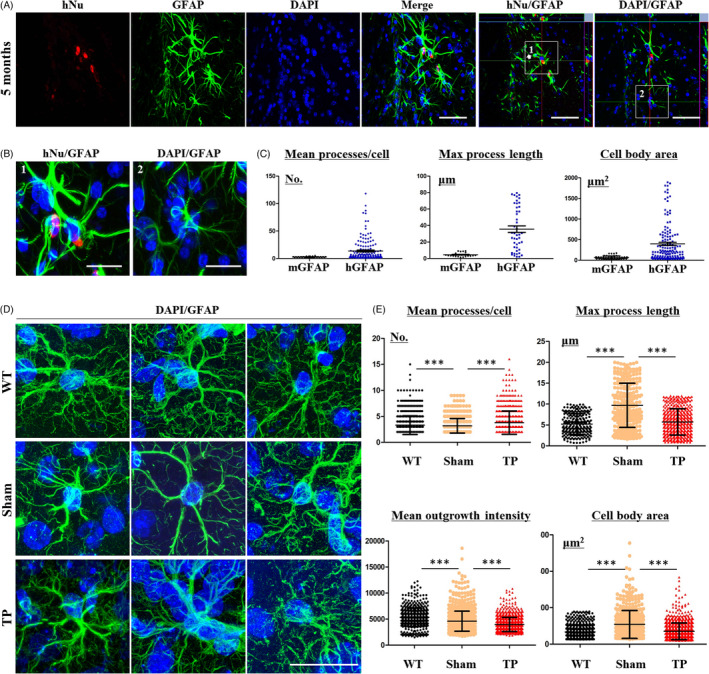
Transplanted iPSC‐NPCs contribute to the differentiation and morphological changes of astrocytes in YAC128 transgenic mice. (A) Double staining for the astrocyte marker GFAP and hNu (Scale bar: 50 μm. 1: merged hNu‐ and GFAP‐positive cells. 2: no merged hNu‐ and GFAP‐positive cells). (B) The difference between hGFAP and mouse GFAP (mGFAP) immunostaining showed morphological changes in HLA‐iPSC‐NPCs‐derived astrocytes. Panel A shows the immunostaining results for hGFAP (1) or mGFAP (2). Scale bar: 20 μm. (C) Quantification of processes, maximal process length, and cell body area in hGFAP‐positive cells and mGFAP‐positive cells (for two regions in 6 brain sections of transplanted group (n = 1)). (D) Morphological differences between endogenous astrocytes in TP mice and WT mice. Scale bar: 20 μm. (E) Quantification of processes, max process length, outgrowth intensity and cell body area in sham, WT and TP mice (for two regions in eight brain sections of each group (n = 3 each), ***P < .001). Data were analysed by two‐way ANOVA followed by a Tukey post hoc test or Student's t test using GraphPad's Prism software