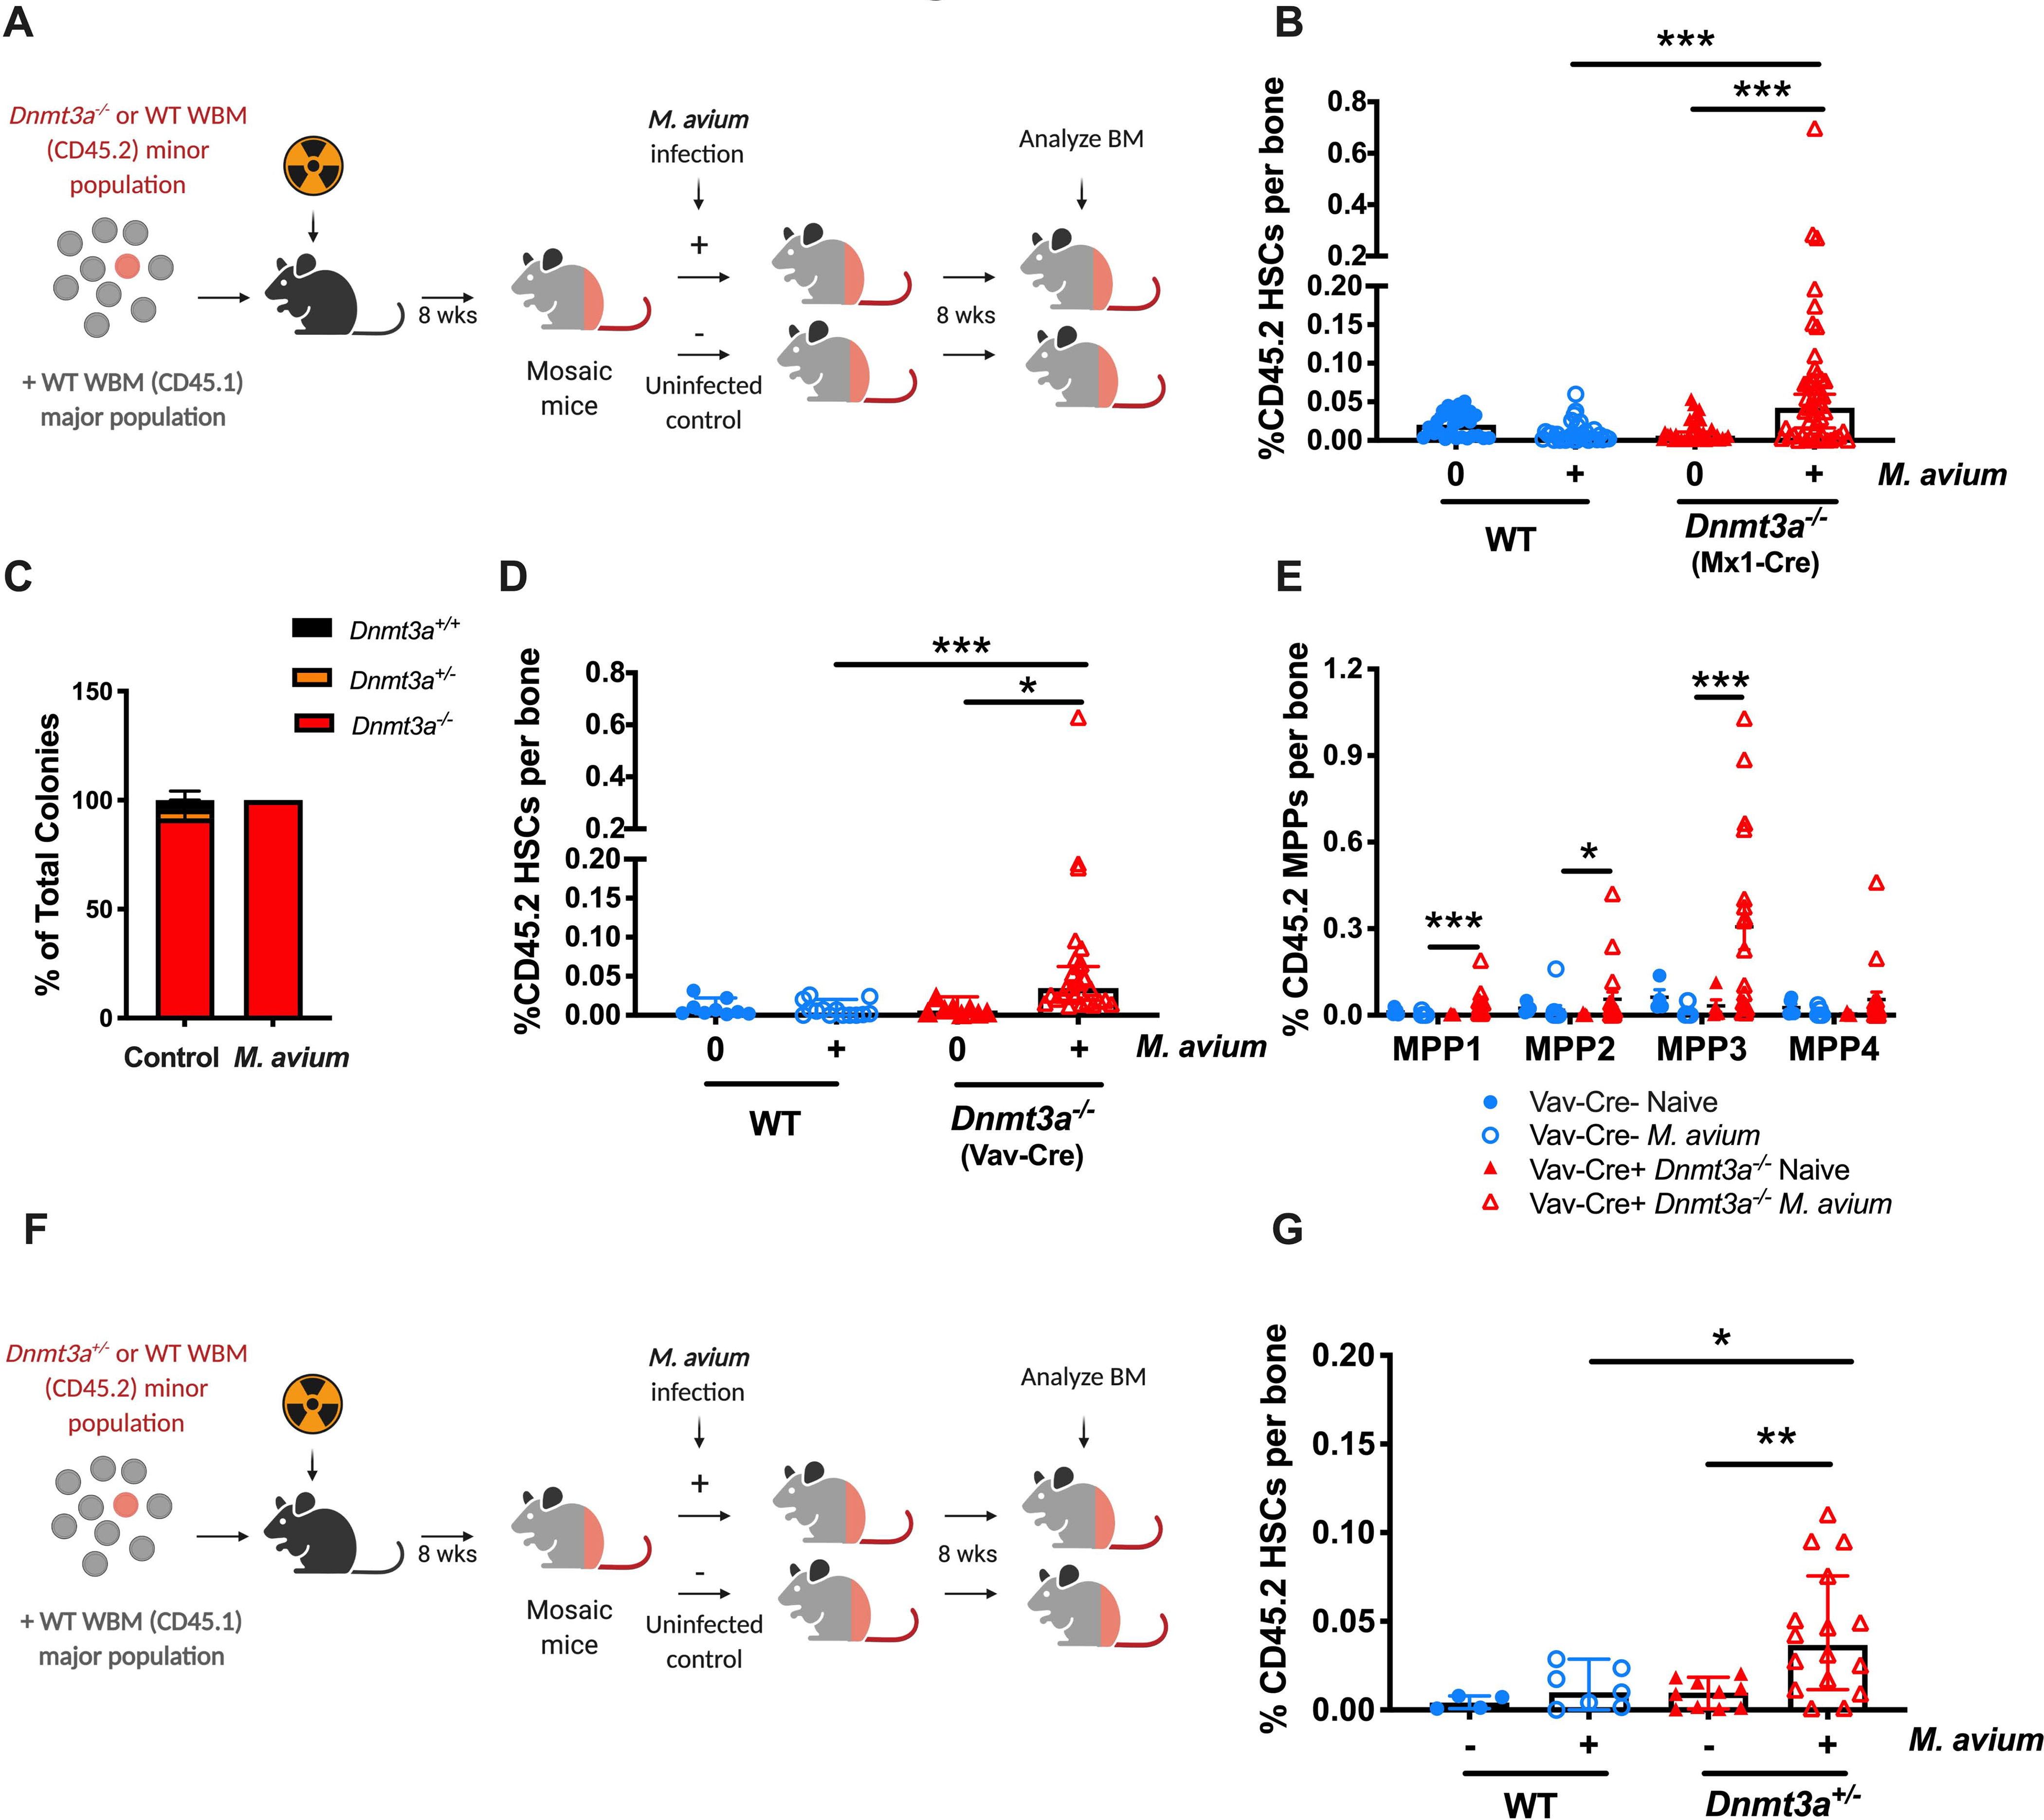
Figure 1. M. avium infection promotes Dnmt3a-mutant clonal expansion in mice.

(A) Mosaic mouse model to compare Dnmt3afl/fl vs Dnmt3a−/− HSCs upon infection. WT recipient mice were transplanted with a minor population of “test” Dnmt3afl/fl or Dnmt3a−/− whole bone marrow and a major population of WT competitor. Two months after transplant, half of the mice were infected with M. avium, and the percent of test (Dnmt3a−/− or WT) CD45.2 HSCs measured eight weeks later. (B) CD45.2 HSCs (KL CD150+ CD48− CD34−) shown as a percentage of WBM in mosaic mice. Dnmt3a−/− cells were from Mx1-Cre Dnmt3afl/fl donors treated with PIPC 4 weeks before transplant. Data represent 4 independent experiments with n=20–40 per group. Median with 95% CI. P values calculated by Kruskal-Wallis test. (C) Genotyping of single-cell derived CD45.2+ colonies from bone marrow of mosaic mice at the end of the experiment; n=12–20 per group. (D) CD45.2 HSCs (KL CD150+ CD48− CD34−) shown as percentage of WBM in mosaic mice. Here, Dnmt3a−/− cells were from Vav-Cre Dnmt3afl/fl donors. n=5–20 per group. Median with 95% CI. P values calculated by Kruskal-Wallis test. (E) CD45.2 MPPs as percentage of total WBM in mosaic mice (corresponding to Figure 1D). (F). Mosaic mouse model to compare WT vs Dnmt3a+/− HSCs upon 2-month of infection with M. avium. (G). CD45.2 HSCs (KL CD150+ CD48− CD34−) shown as a percentage of WBM in mosaic mice model to compare Dnmt3afl/fl vs Dnmt3a+/− HSCs upon infection. Median with 95% CI. P values calculated by Kruskal-Wallis test. *, p < 0.05; **, p < 0.01; ***, p < 0.001.
