
Figure 3: Hematological responses of Dnmt3a−/− mice to infection with M. avium.
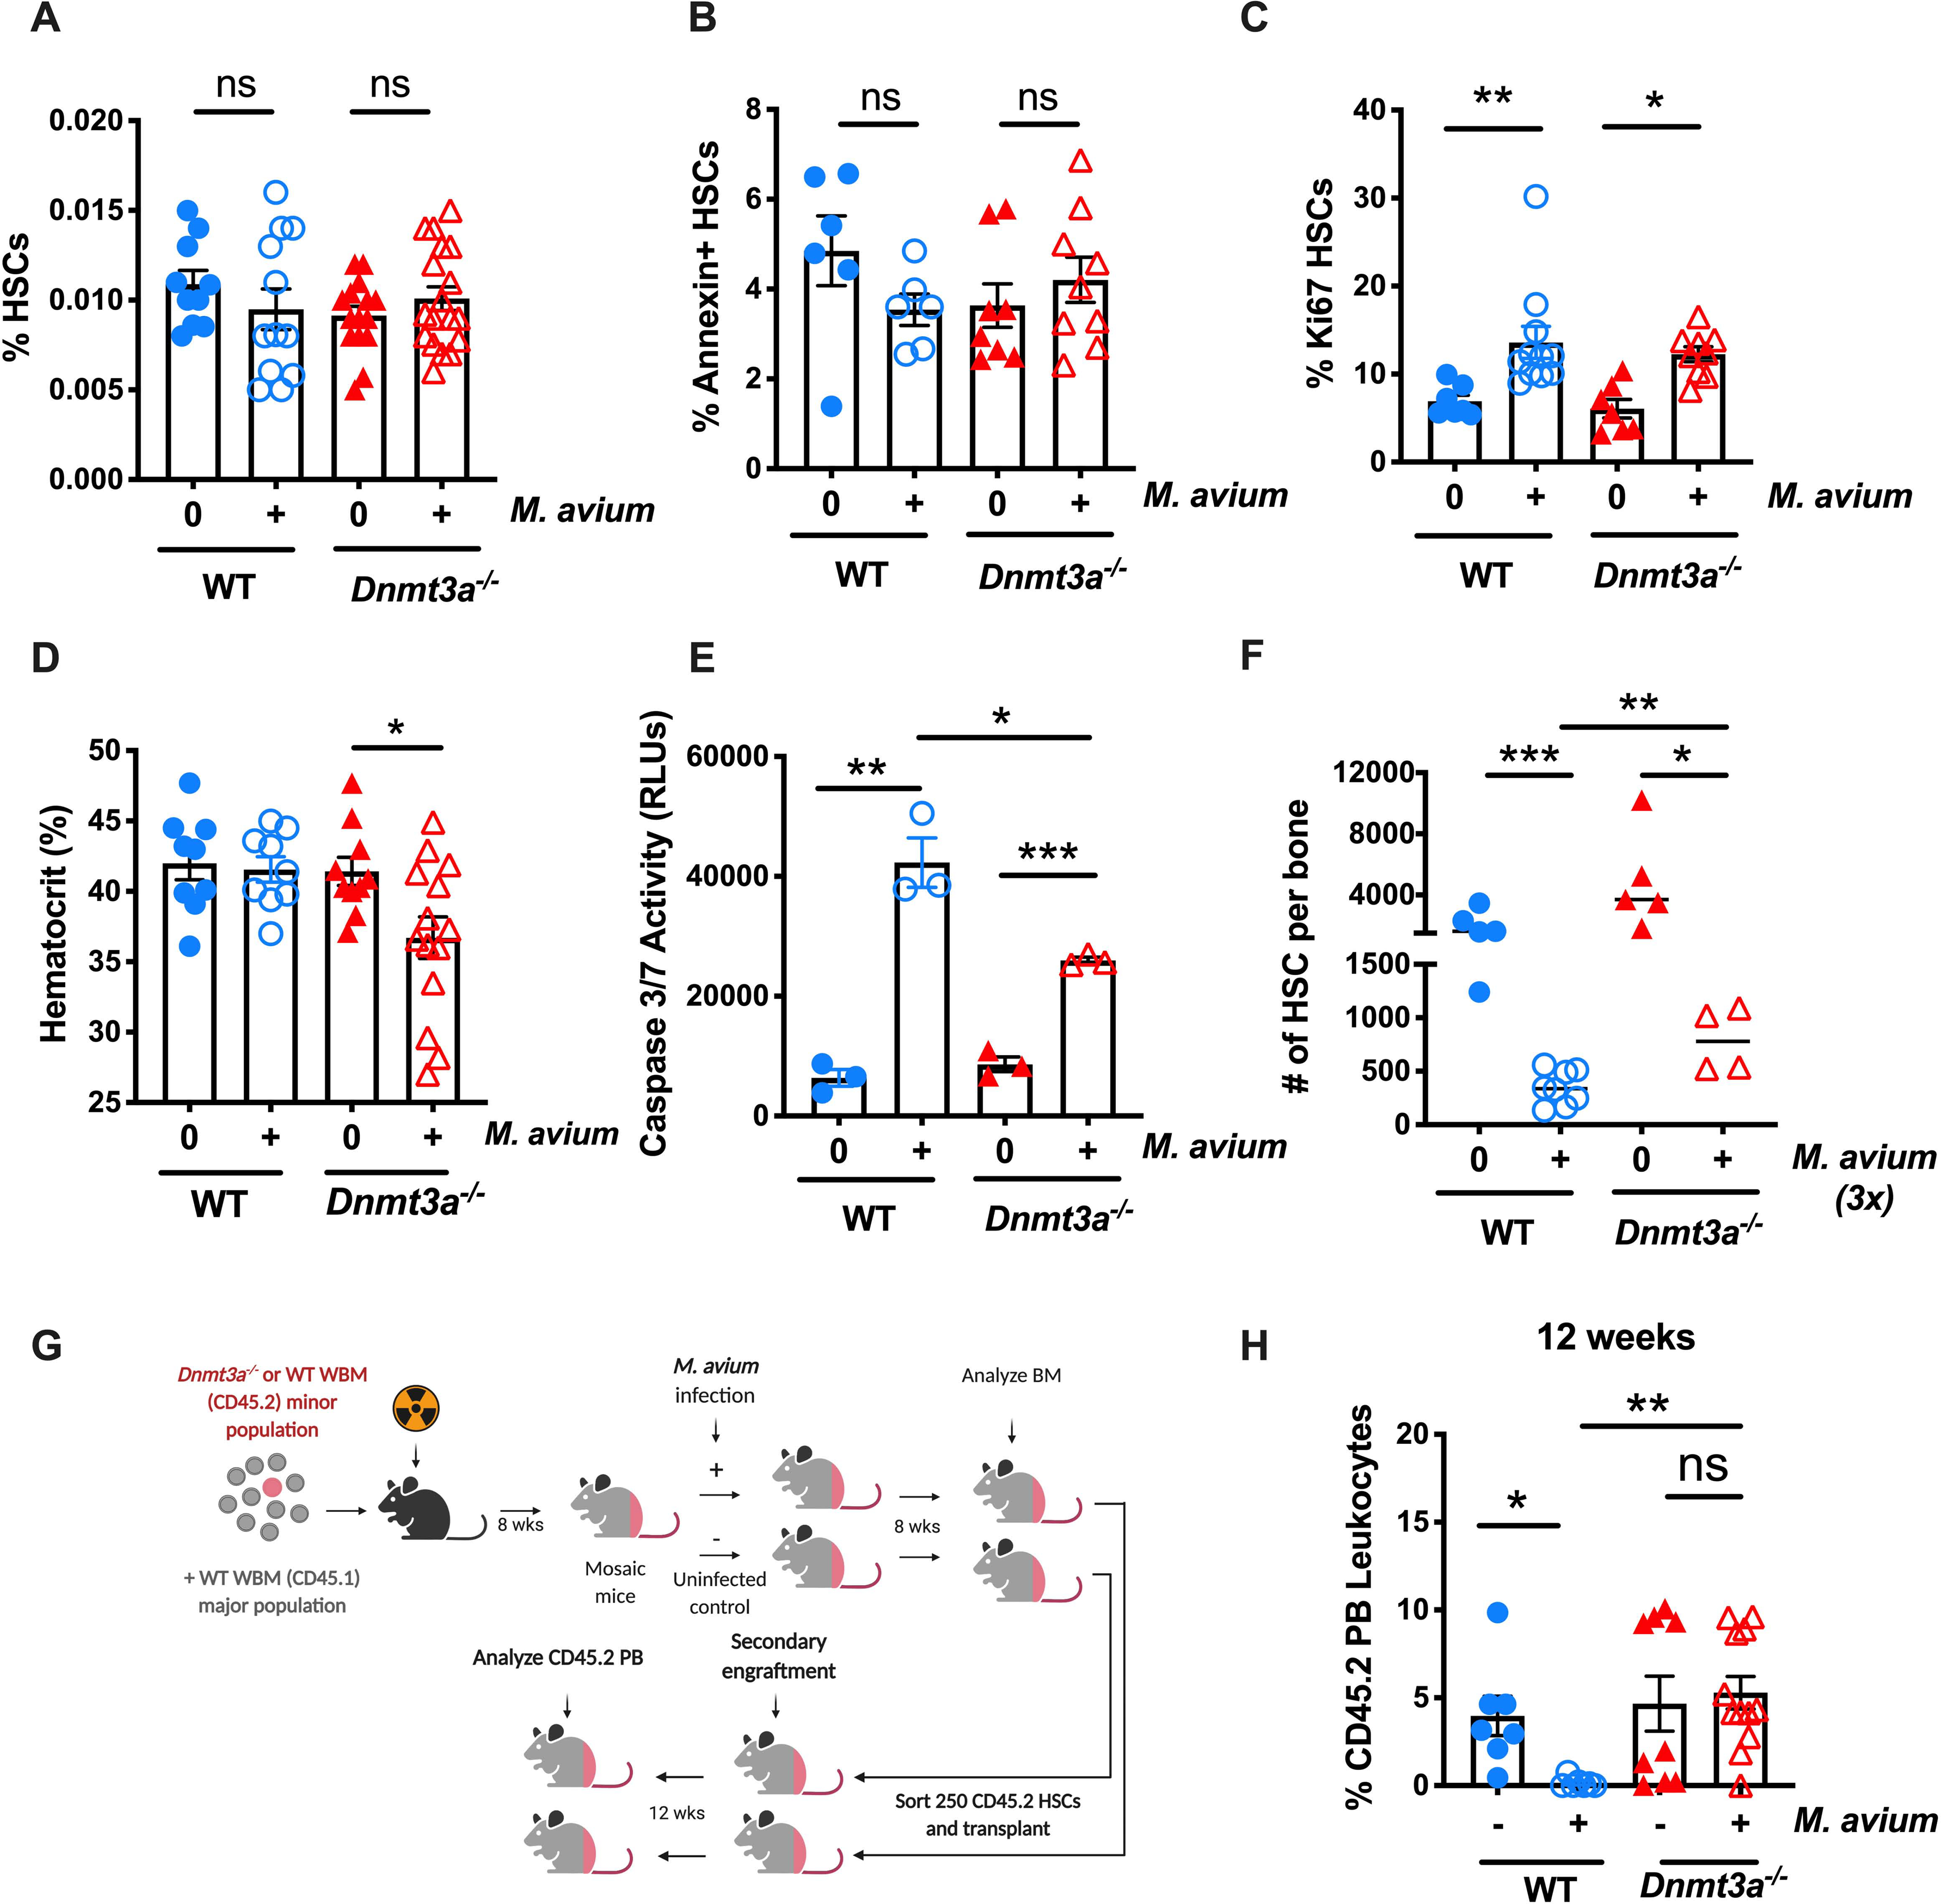
(A-C) WT and Dnmt3a−/− mice were infected with M. avium for 1 month. (A) Percentage of HSCs (KL CD150+ CD48− CD34−) of total WBM. n=10–20 per group; data are representative of 5 independent experiments. Error bars, mean ± SEM. P values calculated by ordinary one-way ANOVA. (B) Percentage of Annexin + HSCs. n=6–10 per group; data are representative of two independent experiments. Error bars, mean ± SEM. P values calculated by ordinary one-way ANOVA. (C) Percentage of Ki67+ HSCs. n=10–15 per group; data are representative of two independent experiments. Error bars, mean ± SEM. P values calculated by ordinary one-way ANOVA. (D) Hematocrit in WT and Dnmt3a−/− mice infected with M. avium for 1 month. n=10–20 per group. Error bars, mean ± SEM. P values calculated by ordinary one-way ANOVA. (E) 400 HSCs (KSL CD150+ CD48− CD34−) were sorted, treated for 12h with IFN-y in vitro prior to Caspase 3/7 assay. n=2–3 per group. Error bars, mean ± SEM. P values calculated by ordinary one-way ANOVA. (F) WT and Dnmt3a−/− mice were infected with M. avium for 3 consecutive months before we analyzed the absolute number of HSCs (KL CD150+ CD48− CD34−) of total WBM. (G) Mouse model of secondary transplant from primary mosaic mice (Figure 1A). 250 sorted donor CD45.2 HSCs (LK CD150+ CD48− CD34−) from previously transplanted animals were co-transplanted with 2.5 × 10⁵ CD45.1 rescue marrow into lethally irradiated mice. PB was assessed 12 weeks post-transplant, and engraftment is shown as percentage of CD45.2 cells in blood (H). Data are presented as mean ± SEM; n = 7–14 per group. P values calculated Kruskal-Wallis test. *, p < 0.05; **, p < 0.01; ***, p < 0.001.