
Figure 4. ASNS expression corresponds to a more metabolically plastic and stress resistant phenotype.
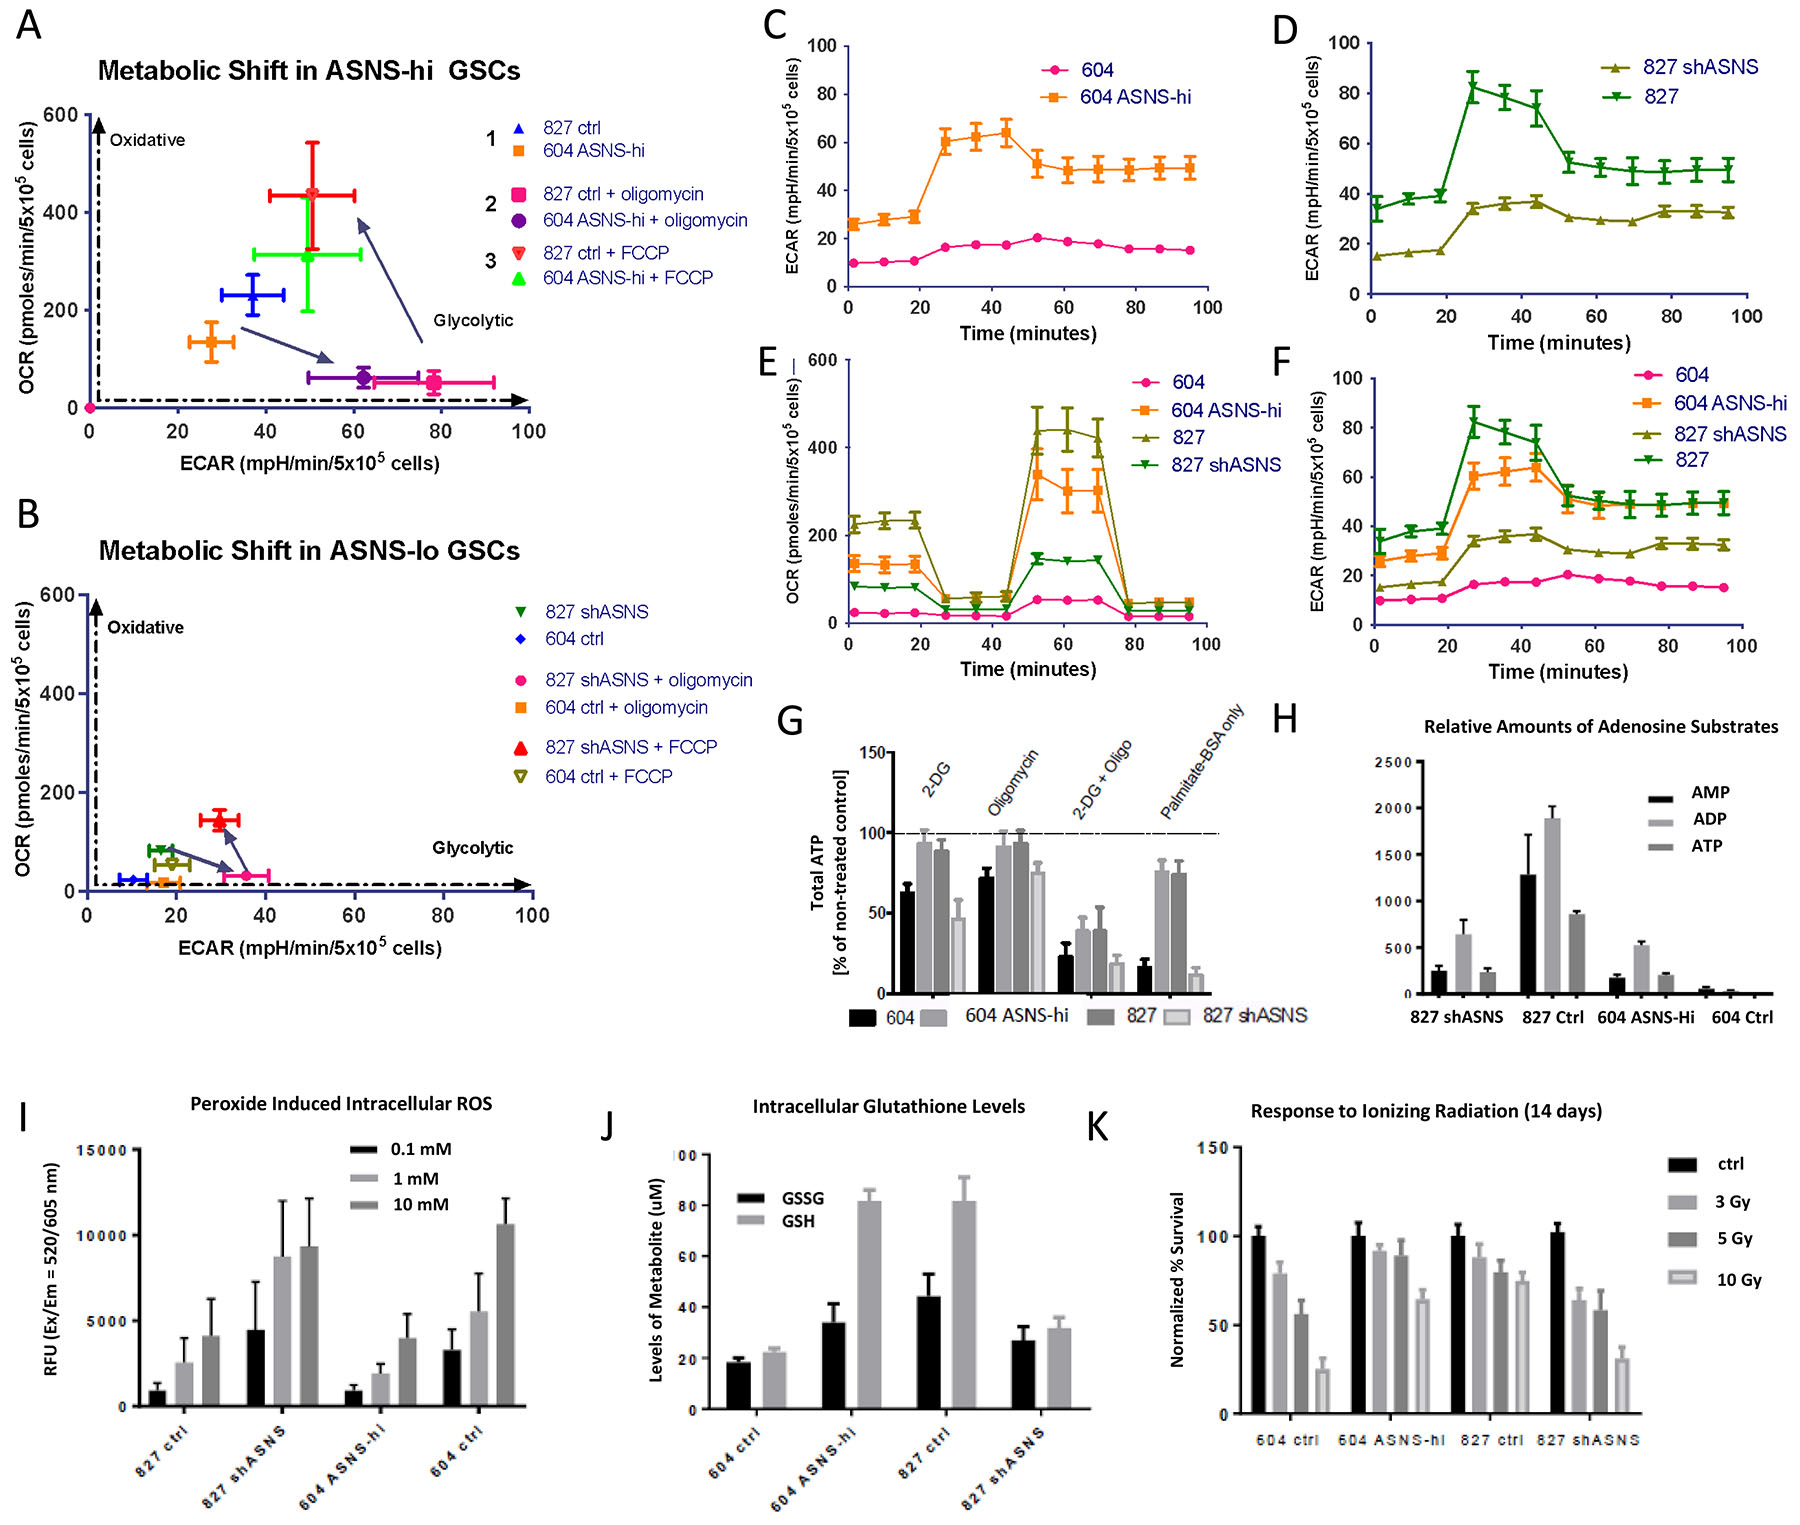
(A, B) ASNS high cells display more robust metabolic plasticity. ASNS high cells can switch between oxidative phosphorylation and glycolysis, bi-directionally more quickly compared to ASNS low cells. These plots express the metabolic transitions in each GSC as seen in the Cell Mito Stress Test, with the application of oligomycin (1 mM), FCCP (1 mM), and rotenone/Antimycin A (0.5 mM). ASNS high cells switch to glycolysis upon treatment with 1mM oligomycin much more quickly than ASNS low cells. (C, D) ECAR plot shows more rapid transition into glycolysis upon mitochondrial inhibition, (E, F) OCR and ECAR more robust in ASNS high GSCs (error bars shown indicate S.E.M). All plots (Fig 4C–F) were normalized in GraphPad, and certain error bars became smaller than the symbols on the data line. Figure 4F represents the combination of plots from Fig 4C and 4D. (G) Total ATP levels under different metabolic inhibitors indicated improved metabolic switching in ASNS high cells, as well as improved fuel flexibility through fatty acid utilization (p<0.0001, student t-test). (H) adenosine substrate levels in cells measured by metabolomics shows higher ATP levels in ASNS high cells versus ASNS low cells. (I) ROS levels in response to hydrogen peroxide treatment (0.1–10 mM) (p<0.001), (J) GSH/GSSG levels in GSCs treated with 1 mM hydrogen peroxide, (K) cell survival post radiation exposure (3–10Gy) for 14 days. Cell survival normalized to control for each GSC based on cell counts at day 14. (p<0.001, student t-test).