Figure 1.
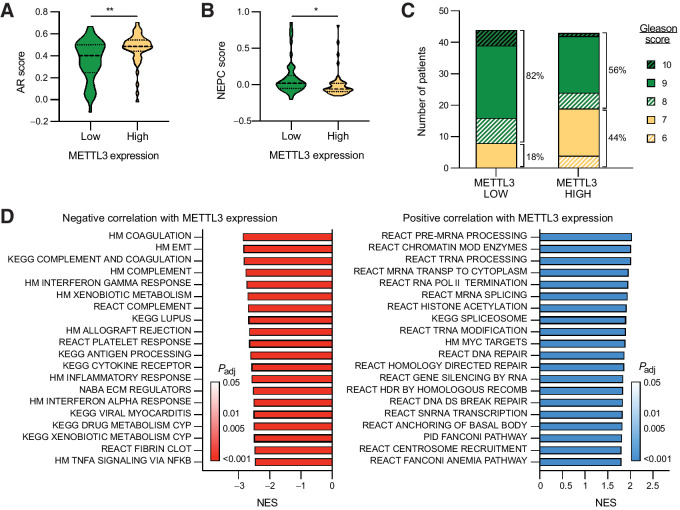
Low METTL3 expression is associated with advanced-stage disease. CRPC samples (43) were grouped based on METTL3 expression: high, z-score > 1, n = 50; low, z-score < −1, n = 49. A, AR score in METTL3-high versus -low samples. Median and quartiles are indicated with a dotted line, P = 0.0011 as determined by t test. B, NEPC score in METTL3-high versus -low samples. Median and quartiles are indicated with a dotted line, P = 0.0214 as determined by t test. C, Gleason score in METTL3-high versus -low samples. P = 0.0111 as determined by Fisher exact test between samples with Gleason 6–7 and Gleason 8+ scores. D, Gene set enrichment analysis of genes differentially expressed in in METTL3-high versus -low samples. Genes were ranked according to the log of the Benjamini and Hochberg–adjusted P value as determined by t test. Shown are the top 20 results in either direction.

