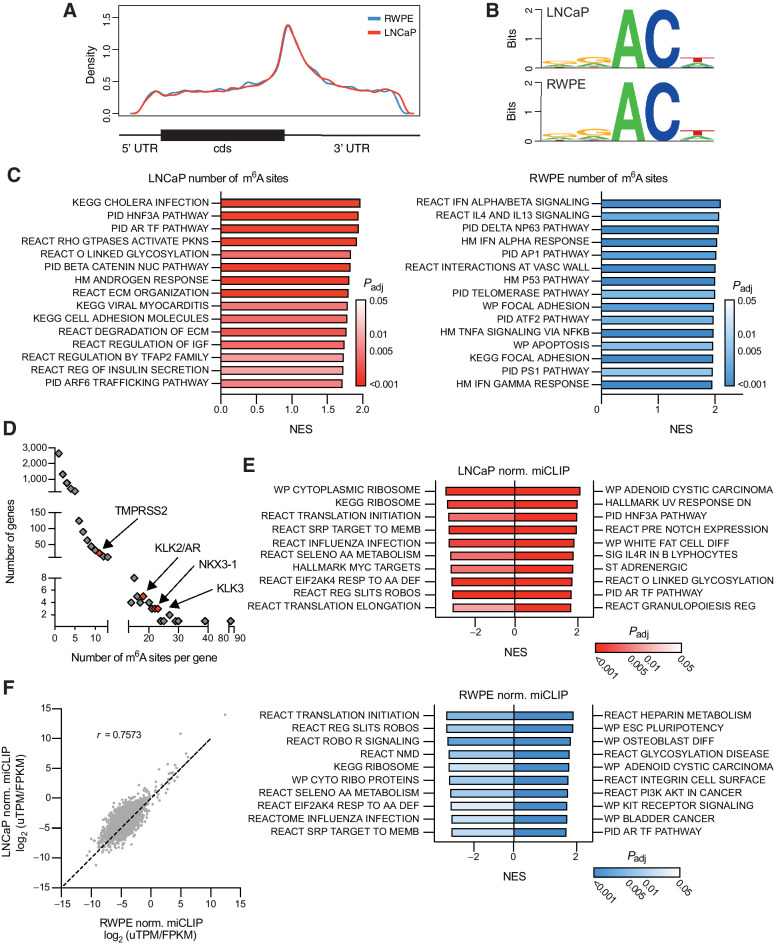
Figure 2.
Mapping genes methylated with m6A in prostate cancer. m6A was mapped in LNCaP and RWPE cell lines using miCLIP. A, Metagene plot of the distribution of m6A residues along the transcript in both cell lines. B, Consensus sequence surrounding m6A sites identified in both cell lines generated with WebLogo. C, Gene set enrichment analysis of genes ranked by the number of m6A sites. Shown are the top 15 gene sets. D, AR signature genes (n = 30; ref. 72) are significantly (P = 0.0004) enriched in m6A sites (>10 sites) as determined by Fisher exact test. E, Gene set enrichment analysis of genes ranked by the total normalized miCLIP unique tags per million for a given transcript. F, Comparing the normalized miCLIP unique tags per million per transcript in genes which are similarly expressed (<10-fold difference) between the LNCaP and RWPE cell lines.

