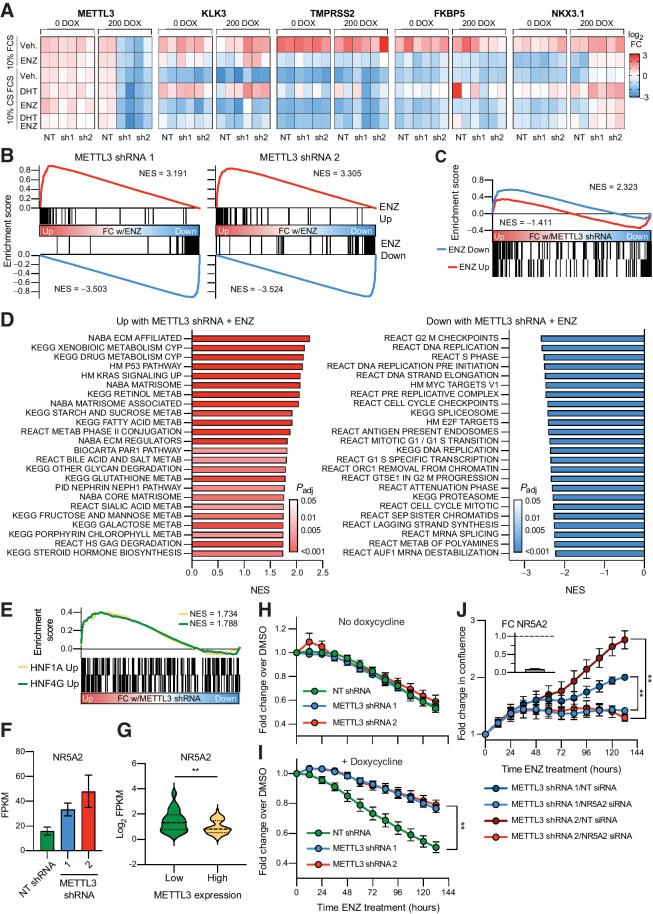
Figure 5.
METTL3 knockdown leads to the induction of a gene signature linked to castration resistance and renders the cells resistant to enzalutamide in an AR-independent manner. A, Change in expression of AR target genes with METTL3 knockdown (±doxycycline) and in response to AR stimulation (10 nmol/L DHT) or inhibition (10 μmol/L ENZ). Expression was measured via qPCR (n = 2) and is displayed as the fold change with treatment per gene and experiment. B, RNA-seq analysis of METTL3 knockdown lines treated with ENZ demonstrates no change in the repression or activation of known ENZ target genes by gene set enrichment analysis. Genes were ranked according to the fold change ENZ versus vehicle as determined by DESeq2. ENZ up and down gene lists contain the common differentially expressed genes from two published RNA-seq experiments (GSE110903 and GSE147250). C, Some ENZ-responsive genes show differential expression with METTL3 knockdown. Ranking for gene set enrichment analysis was according to the combined fold change ENZ versus vehicle as determined by DESeq2 for both METTL3 shRNA lines. D, Gene set enrichment analysis of genes differentially expressed with ENZ treatment and METTL3 knockdown. Genes were ranked according to the combined Wald statistic from DESeq2 for both METTL3 shRNA lines as compared with the NT shRNA. Shown are the top 24 results in either direction. E, METTL3 knockdown with ENZ treatment induces the expression of HNF1A and HNF4G target genes. Genes were ranked according to the combined Wald statistic from DESeq2 for both METTL3 shRNA lines as compared with the NT shRNA. HNF target genes were taken from previously published overexpression experiments in LNCaP cells (GSE85559). F, NR5A2 is overexpressed with METTL3 knockdown and ENZ treatment (n = 3, error bars = SEM) G, NR5A2 expression in METTL3-high versus -low samples (see Fig. 1). Median and quartiles are indicated with a dotted line, P = 0.0034 as determined by t test. H, In the absence of METTL3 knockdown, the shRNA lines respond similarly to 10 μmol/L ENZ treatment (n = 3, error bars = SEM). I, Induction of METTL3 knockdown renders the cells resistant to ENZ treatment (n = 4, error bars = SEM; sh1 P = 0.0012, sh2 P = 0.0011, as determined by t test). For both panels, shown is the change in cell confluency as compared with DMSO with time as measured via Incucyte imaging. J, Knockdown of NR5A2 significantly reverses the ability of the METTL3 knockdown cells to proliferate in the presence of 10 μmol/L ENZ (n = 3, error bars = SEM; sh1 P = 0.001003, sh2 P = 0.001223, as determined by t test). Plotted is the fold change in confluency compared with time zero. Sufficient NR5A2 knockdown (91%) was confirmed in tandem by qPCR and is plotted in the top left as fold change over NT siRNA (n = 3).

