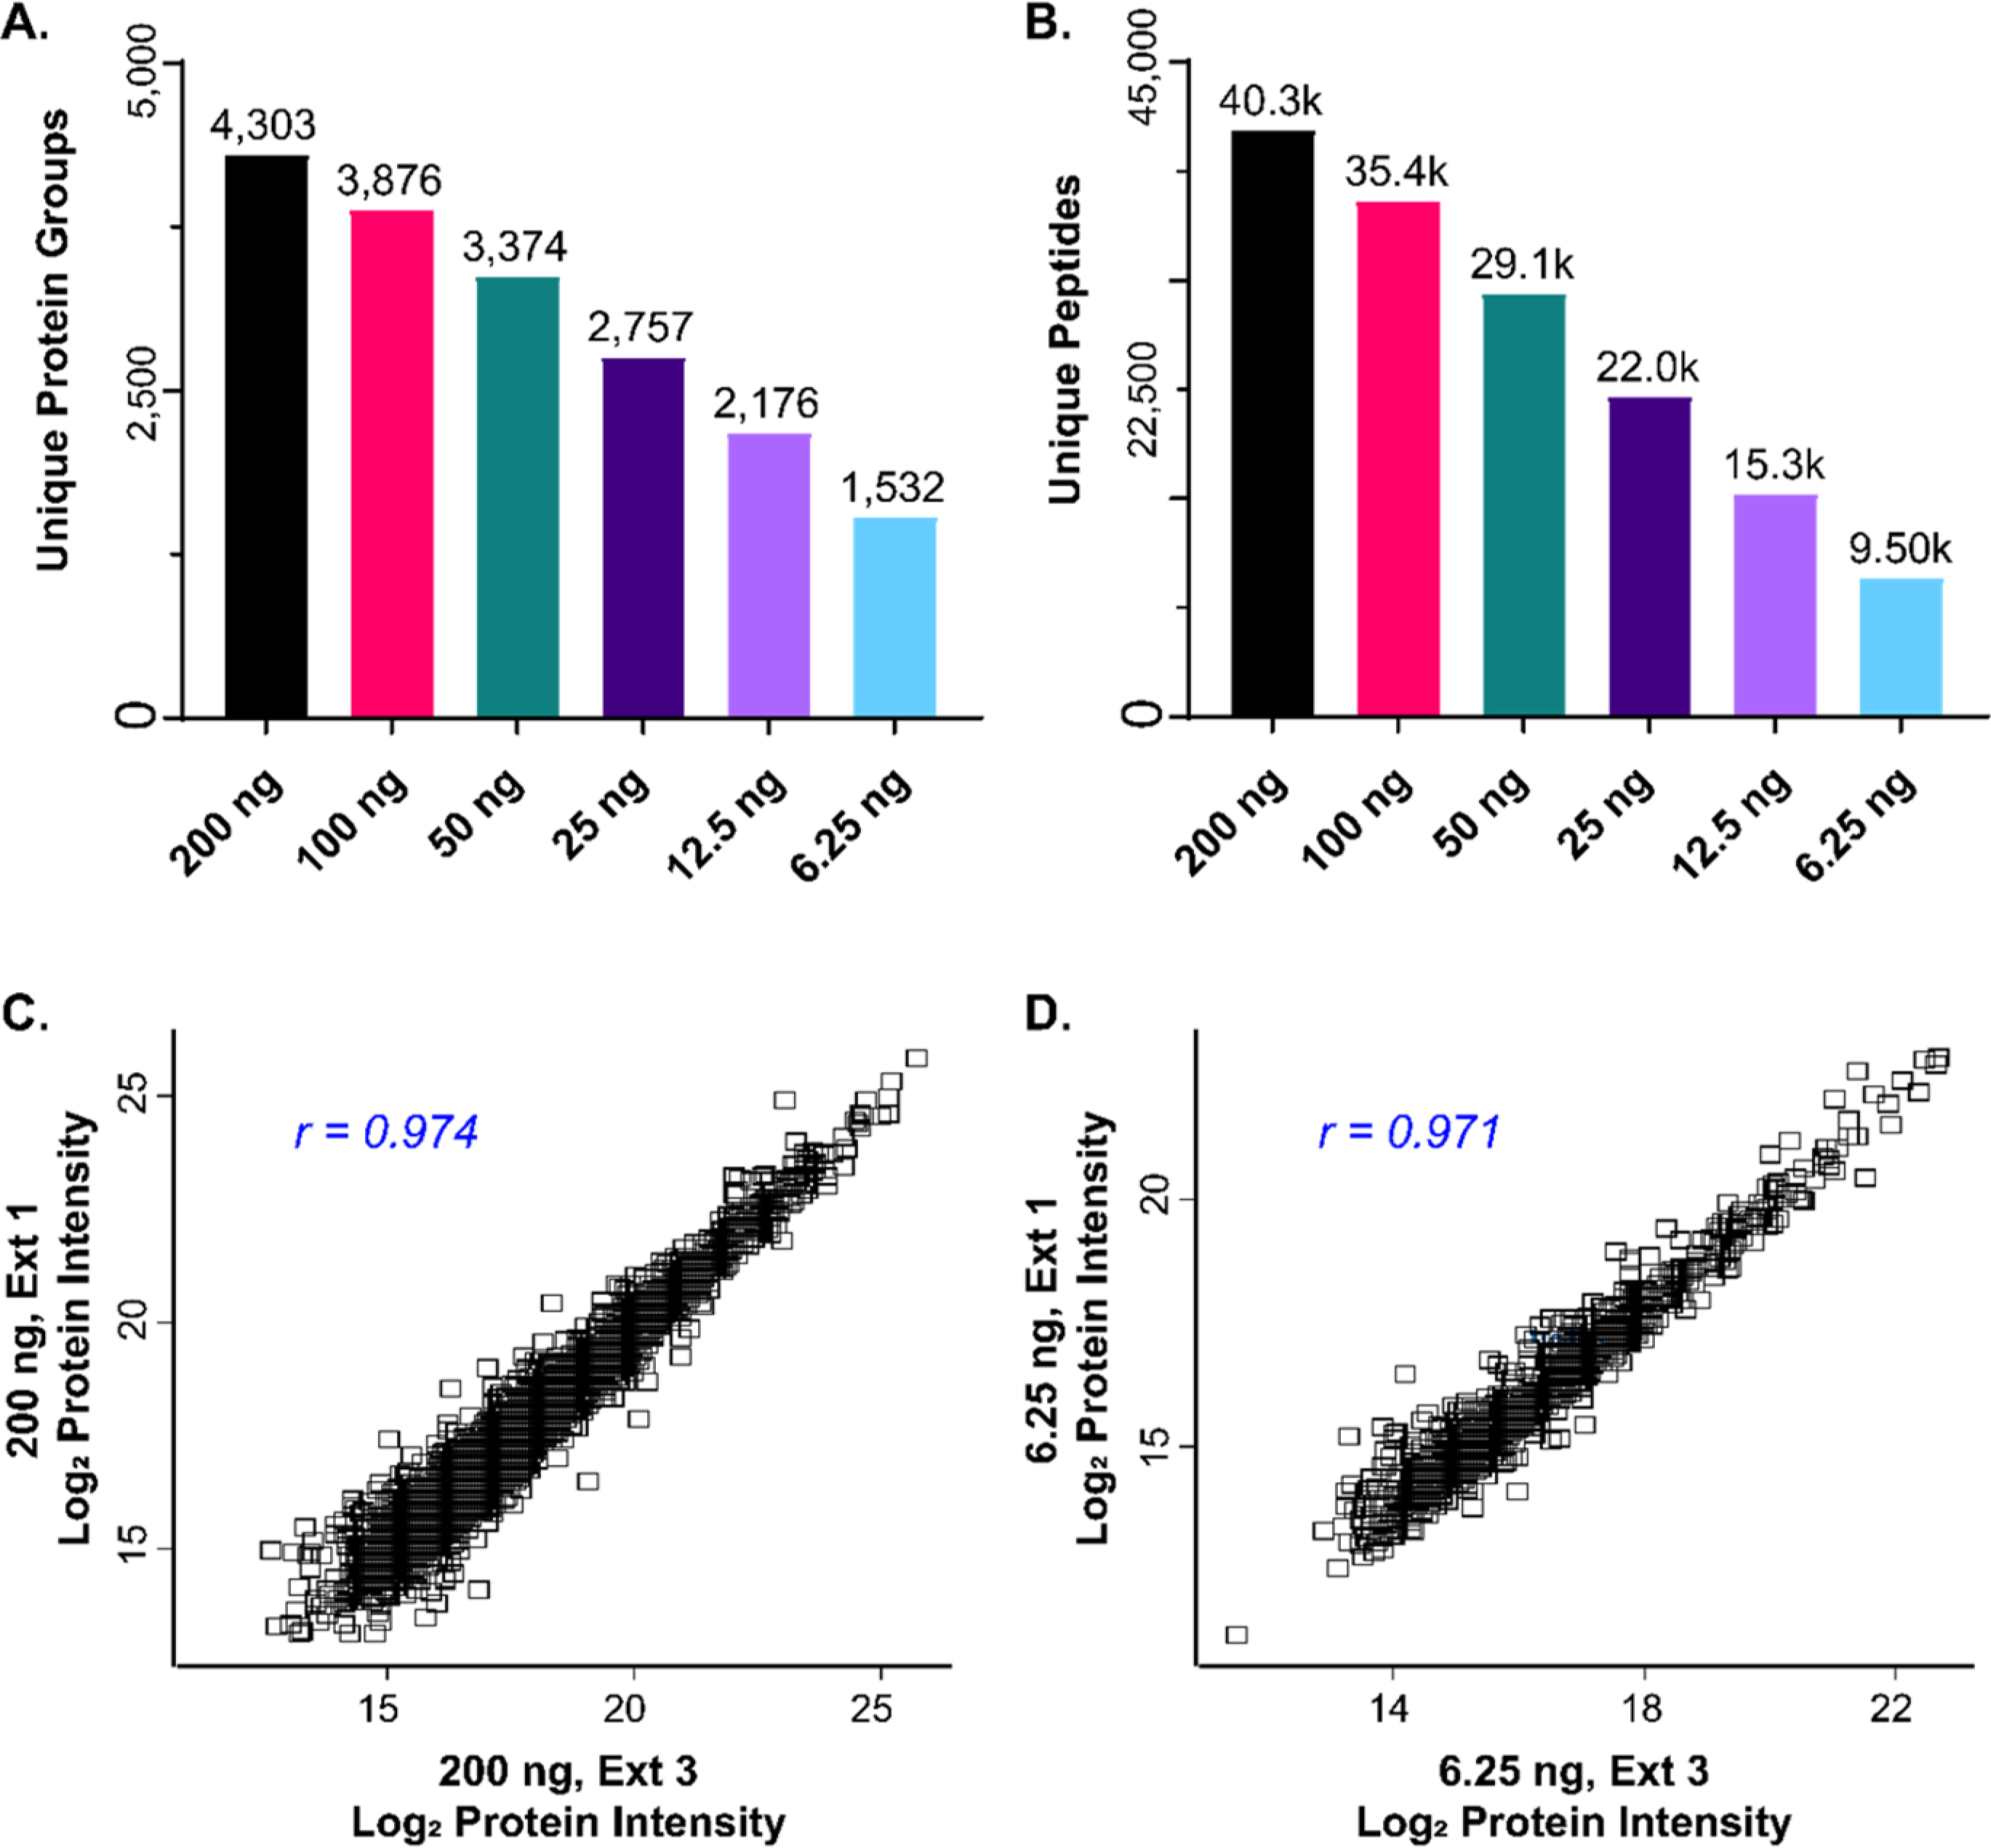
Figure 4.

LFQ analysis with high reproducibility from low sample loading amounts on the timsTOF Pro. (A,B) Bar charts showing the total number of unique protein groups (A), and unique peptides (B), identified by MaxQuant from injections of 200, 100, 50, 25, 12.5, and 6.25 ng of digested peptide (n = 3 technical replicates for each group), respectively. Total number of identifications are displayed above each bar. (C,D) Scatterplots of Log2LFQ protein intensities showing high reproducibility between replicates from 200 ng (C) and 6.25 ng (D) injections. Pearson correlation coefficients are shown in the top left corner of each panel.
