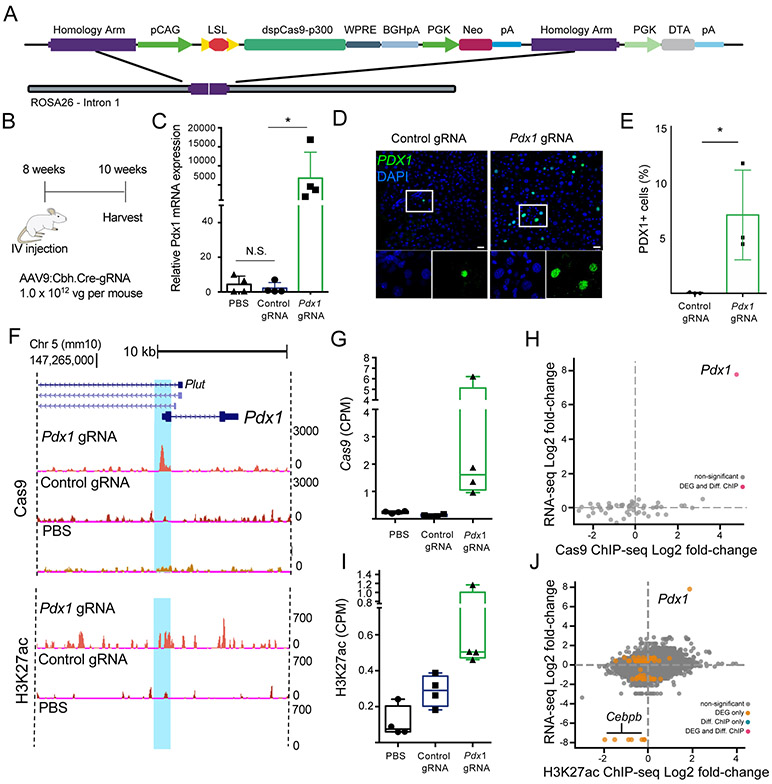
Figure 1: AAV-based gRNA and Cre recombinase delivery to Rosa26:LSL-dCas9p300 mice activates Pdx1 gene expression and catalyzes targeted histone acetylation.
A) Schematic of Rosa26:LSL-dCas9p300 (dCas9p300) knock-in locus. B) Experimental design for in vivo Pdx1 activation. C) Pdx1 mRNA quantification 8 weeks post-injection in liver tissue lysates isolated from mice injected with phosphate-buffered saline (PBS), or AAV9 encoding Cre and either a control non-targeting or Pdx1-targeting gRNA (n=4 per group, Kruskal-Wallis one-way ANOVA with Dunnett’s post-hoc, *p=0.0132). D) PDX1 immunostaining of liver tissue sections at 14 days post-injection of mice treated with control and Pdx1-targeted gRNAs. Scale bar = 50 μm E) Quantification of PDX1+ nuclei in control gRNA and Pdx1 gRNA treated animals (7.0% vs 0.03%, p=0.019, students t-test, n = 3 animals, with 3 images counted per animal). F) Representative browser tracks of dCas9 and H2K27ac ChIP-Seq data from treated livers at 2 weeks post-treatment (replicates are presented in Figures S3 and S4). G) dCas9 ChIP-seq quantification of sequencing counts (CPM = counts per million) in the gRNA target region of Pdx1 in samples from mice treated with Pdx1-targeted gRNA, control gRNA, or PBS (n = 4, one-way ANOVA with Dunnett’s post-hoc, p=0.059). H) RNA-seq and Pdx1 ChIP-seq analyses showing the relationship between changes in gene expression and occupancy of Cas9 genome-wide. Log2(fold-change) was calculated using the ratio of read counts between samples treated with the Pdx1-targeted gRNA relative to control non-targeting gRNA in dCas9p300 cells (n = 4, FDR < 0.05). I) H3K27ac ChIP-seq quantification of sequencing counts within a 1 kb window centered on the gRNA target site near the TSS of Pdx1 in samples from mice treated with the Pdx1-targeted gRNA, control gRNA, or PBS (n = 4, two-tailed student’s t-test, p = 0.07). J) RNA-seq and H3K27ac ChIP-seq analysis showing the relationship between changes in gene expression and genome-wide H3K27 acetylation for samples from mice treated with the Pdx1-targeted gRNA and control gRNA, (n = 4, FDR < 0.05, DEG = differentially expressed gene, orange dot; Diff. ChIP = differentially enriched ChIP-seq signal, blue dot; DEG and Diff. ChIP = differentially expressed gene and ChIP-seq enrichment, red dot). All bar-plot error bars represent standard deviation, all boxplots are drawn from 25th to 75th percentile with the horizontal bar at the mean and whiskers extending to the minima and maxima

