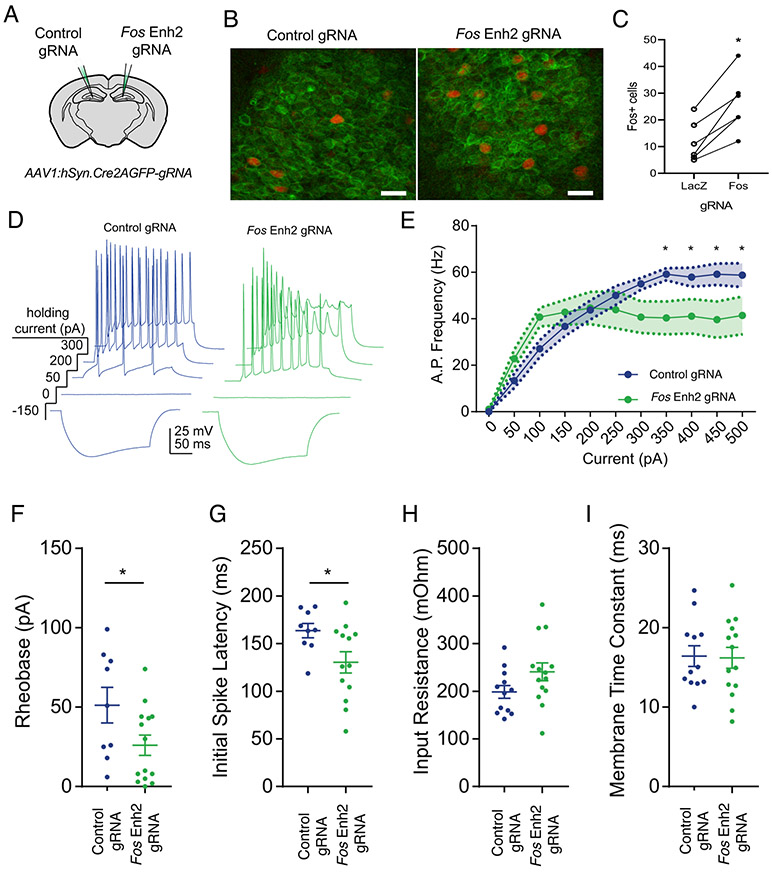
Figure 2: Epigenomic enhancement of Fos in vivo increases excitability in CA1 neurons.
A) Contralateral AAV injection strategy for comparison of targeting and non-targeting control gRNAs. AAV:Syn1-Cre.gRNA was injected into in the hippocampus of dCas9p300 mice. A gRNA targeting LacZ was used as control for the gRNA targeting Fos enh2. B) Immunoflourescence imaging of neurons in the dendate gyrus region of the hippocampus after transduction with AAV containing LacZ control-gRNA or Fos Enh2-gRNA and stimulation with novel objects. (AAV-gRNA+ neurons (green), FOS+ neurons (red). scale bar = 20 μm). C) Quantification of those FOS+ neurons in (B). The lines connect measurements from the two sides of the same mouse. Counts of FOS+ cells in tissue slices from n=6 paired ROIs per condition from 3 animals. p = 0.002 by student’s paired two-sided t-test. D) Representative current clamp traces from acute hippocampal slices. Virally-expressed GFP was used to identify CA1 neurons for recording. E) Summary of input/output. For current F(10,240) = 31.12, p < 0.0001, virus F(1,24) = 1.05, p = 0.32 and current x virus interaction F(10,240) = 4.64, p < 0.0001. For Fos Enh2 vs LacZ control at 350 pA p = 0.016, at 400 pA p = 0.031, at 450 pA p = 0.012, and at 500 pA p = 0.026 (two-way repeated measures ANOVA with post-hoc Fisher’s LSD test; * denotes p < 0.05.) F) Rheobase, minimal current to spike. G) Latency to first spike (p = 0.018). H) Input resistance (p = 0.092). I) Membrane time constant (p = 0.091). n=12 LacZ, n=14 Fos Enh2, each from 2 animals (For F-I, two-tailed students t-test; horizontal bars show mean; error bars show SEM).

