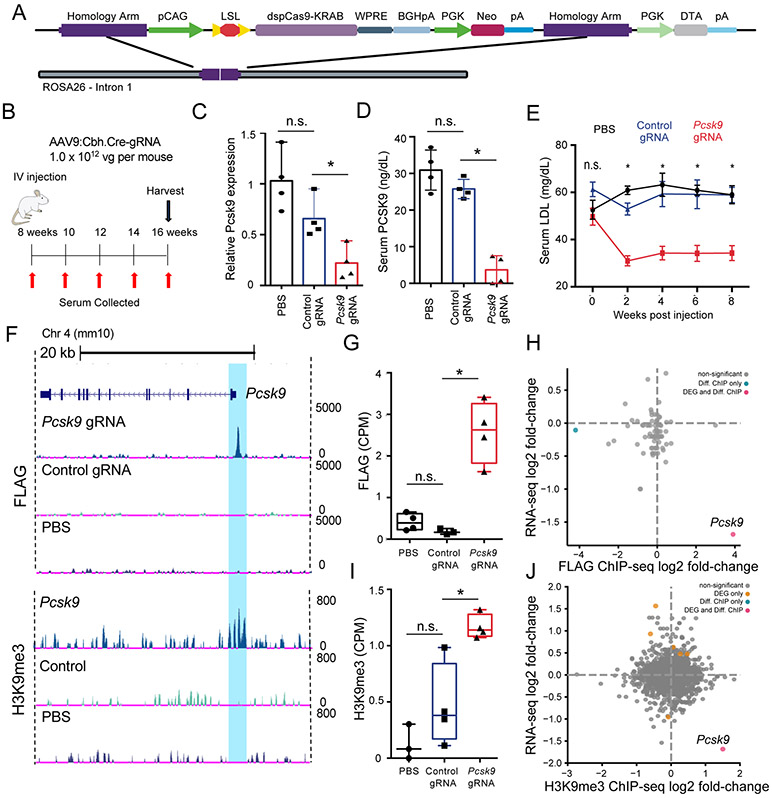
Figure 3: AAV-based gRNA and Cre recombinase delivery to Rosa26:LSL-dCas9KRAB mice represses Pcsk9 and catalyzes targeted histone methylation.
A) Schematic of Rosa26:LSL-dCas9KRAB (dCas9KRAB) knock-in locus. B) Schematic of the experimental design to test Pcsk9 repression in the dCas9KRAB mice. C) Pcsk9 mRNA quantification 8 weeks post injection in liver tissue lysates isolated from mice injected with phosphate-buffered saline (PBS), or AAV9 encoding Cre and either a control non-targeting or Pcsk9-targeting gRNA (n = 4 per group, one-way ANOVA with Dunnett’s post-hoc, *p = 0.0021) D) PCSK9 serum protein levels at 4 weeks post injection of PBS or AAV9 encoding Cre and either a control non-targeting or Pcsk9-targeting gRNA (n = 4 per group, one-way ANOVA with Dunnett’s post-hoc, * p=0.0001). E) LDL cholesterol levels in the serum at 8 weeks following administration of PBS, or AAV9:Cbh.Cre containing either a control non-targeting or Pcsk9-targeting gRNA (N=4 per group, two-way ANOVA with Tukey’s, * denotes p<0.0001). F) Representative browser tracks of dCas9KRAB (FLAG epitope) and H3K9me3 ChIP-Seq data from liver samples at 8 weeks post treatment (replicates are presented in Figures S10 and S11). Highlighted region corresponds to the area surrounding the gRNA target site in the Pcsk9 promoter. G) dCas9-FLAG ChIP-seq quantification of sequencing counts (CPM = counts per million) in the Pcsk9 promoter in samples treated with Pcsk9-targeted gRNA (n = 4), control non-targeting gRNA (n = 3), or PBS (n = 4) (one-way ANOVA with Dunnett’s post-hoc, p < 0.05.). H) Log2(fold-change) of RNA-seq and FLAG ChIP-seq signal comparing read counts in peaks between samples treated with Pcsk9-targeted gRNA (n = 4) and control non-targeting gRNA (n = 3) showing the relationship between gene expression and genome-wide dCas9KRAB binding. (Diff. ChIP = differentially enriched ChIP-seq signal, blue; DEG and Diff. ChIP = differentially expressed gene and ChIP-seq enrichment, red; FDR < 0.05. I) H3K9me3 ChIP-seq quantification of sequencing counts (CPM = counts per million) in the Pcsk9 promoter in samples treated with Pcsk9-targeted gRNA (n = 4), control non-targeting gRNA (n = 4), or PBS (n = 4) (one-way ANOVA with Dunnett’s post-hoc, p < 0.05.). J) Log2(fold-change) of RNA-seq and H3K9me3 ChIP-seq signal comparing read counts in peaks for samples treated with the Pcsk9-targeting gRNA (n = 4) and control non-targeting gRNA (n = 4) (DEG = differentially expressed gene, orange; Diff. ChIP = differentially enriched ChIP-seq signal, blue; DEG and Diff. ChIP = differentially expressed gene and ChIP-seq enrichment, red; FDR < 0.05). All bar-plot error bars represent standard deviation, all boxplots are drawn from 25th to 75th percentile with the horizontal bar at the mean and whiskers extending to the minima and maxima

