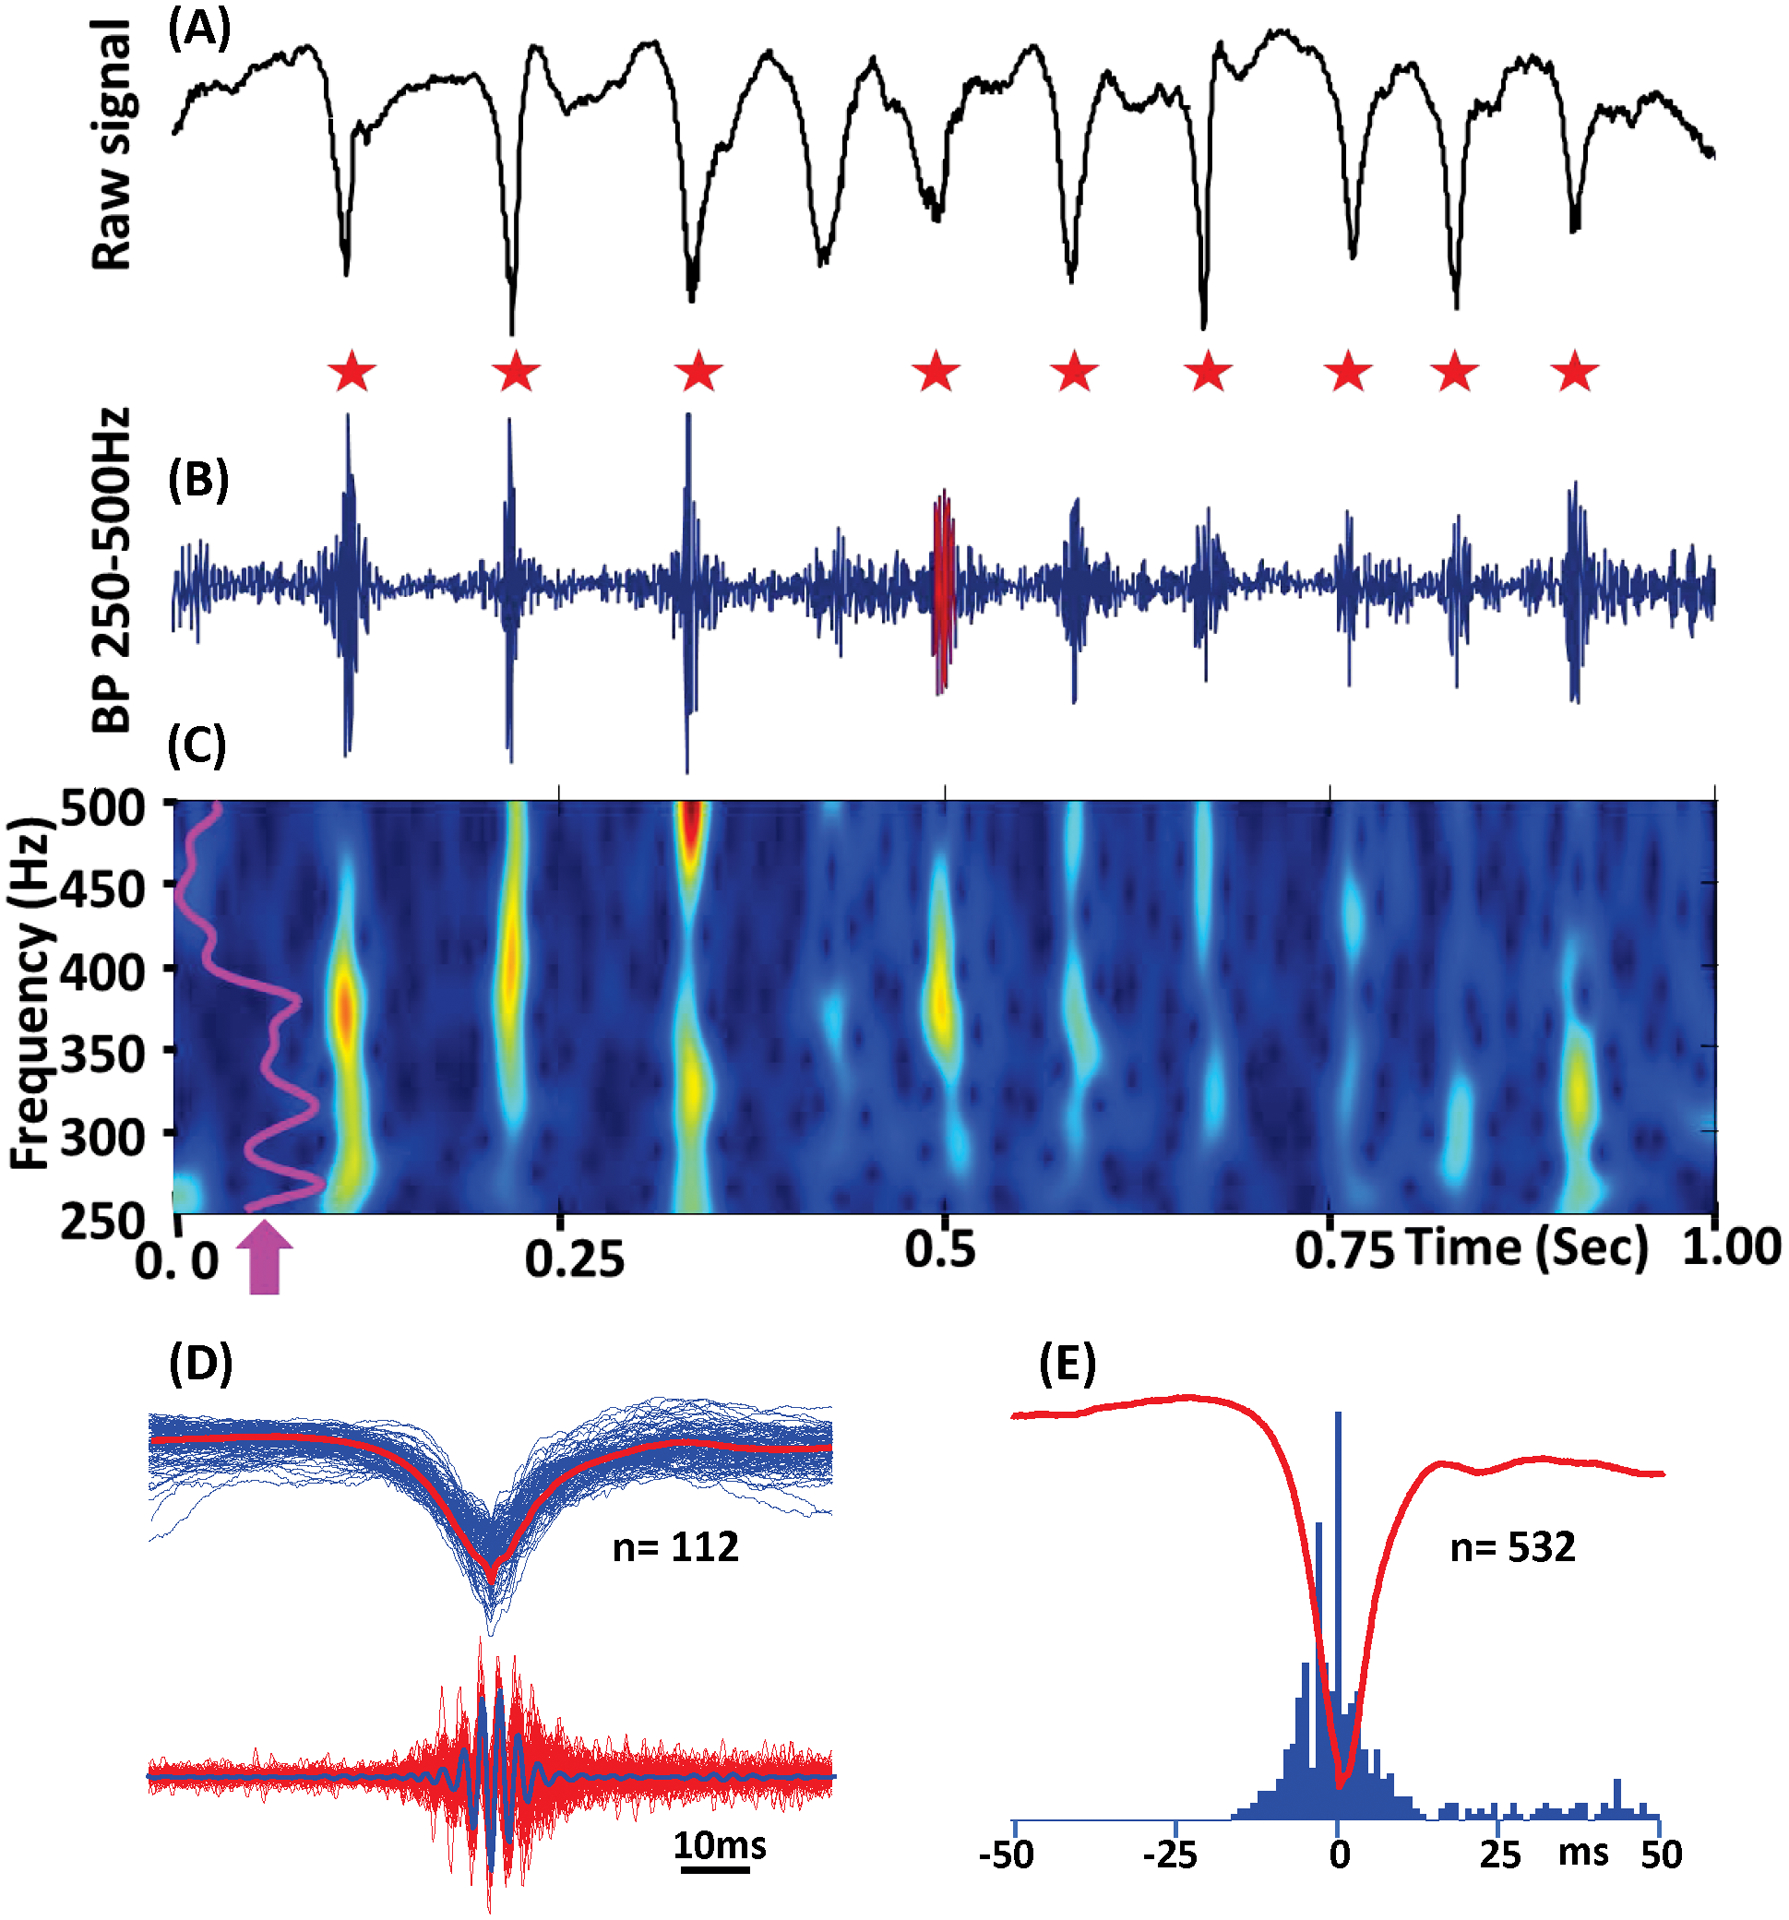
FIGURE 4.

Example of SWDFR from E+ group. A, Raw SWD event. B, Band pass (250–500Hz) signal. Fast ripples associated with the SWD spikes are indicated by red stars. C, Time frequency plot of the event presented above. Purple line (arrow) represents normalized power histogram. D, Superposition of 112 SWD spikes (top) and FR oscillations (bottom). The red line on the top and the blue line at the bottom are average of SWD spikes and FR oscillations. E, Perievent histogram of FR oscillations triggered by SWD local field potential spikes.
